Exercise
In this exercise, you’ll launch the Elastic stack responsible for log management.
The ELK (Elastic) stack
This stack is frequently used, particularly for ingesting and indexing logs. It consists of 3 software components:
- Logstash which allows filtering/formatting incoming data and sending it to Elasticsearch (and other applications)
- Elasticsearch, the engine responsible for data indexing
- Kibana, the web application for data visualization
Purpose of this example
In this example, we’ll use Docker Compose to launch an ELK stack by configuring Logstash to:
- receive log entries on an HTTP endpoint
- extract fields present in each entry and add reverse geocoding information
- send each line to Elasticsearch
The Kibana interface will allow us to visualize logs and create dashboards.
Note: we’ll consider that the log files are generated by a web server like apache/nginx, this will be useful for specifying how Logstash should perform parsing.
Application definition in Compose format
To define our ELK stack, create an elk directory and, inside it, the compose.yml file with the following content:
services:
  logstash:
    image: logstash:7.14.2
    environment:
      discovery.seed_hosts: logstash
      LS_JAVA_OPTS: "-Xms512m -Xmx512m"
    volumes:
      - ./logstash.conf:/config/logstash.conf
    command: ["logstash", "-f", "/config/logstash.conf"]
    ports:
      - 8080:8080
  elasticsearch:
    image: elasticsearch:7.14.2
    environment:
      discovery.type: single-node
      ES_JAVA_OPTS: "-Xms512m -Xmx512m"
  kibana:
    image: kibana:7.14.2
    ports:
      - 5601:5601
Notes:
- The Logstash service is based on the official logstash:7.14.2 image. Under the volumes key, we specify that the logstash.conf configuration file in the directory is mounted to /config/logstash.conf in the container. It will be taken into account by Logstash at startup
- The Kibana service is based on the official kibana:7.14.2 image. The port mapping will make the web interface available on port 5601 of the host machine.
Logstash configuration file
Let’s first define a configuration file for Logstash. In the elk directory (where the compose.yml file is), create the logstash.conf file with the following content:
input {
 http {}
}

filter {
 grok {
   match => [ "message" , "%{COMBINEDAPACHELOG}+%{GREEDYDATA:extra_fields}"]
   overwrite => [ "message" ]
 }
 mutate {
   convert => ["response", "integer"]
   convert => ["bytes", "integer"]
   convert => ["responsetime", "float"]
 }
 geoip {
   source => "clientip"
   target => "geoip"
   add_tag => [ "nginx-geoip" ]
 }
 date {
   match => [ "timestamp" , "dd/MMM/YYYY:HH:mm:ss Z" ]
   remove_field => [ "timestamp" ]
 }
 useragent {
   source => "agent"
 }
}

output {
 elasticsearch {
   hosts => ["elasticsearch:9200"]
 }
 stdout { codec => rubydebug }
}
This file might seem a bit complicated. It can be divided into 3 parts:
input: specifies input data. Here we specify that Logstash can receive data (log entries) over http
filter: specifies how input data should be processed before moving to the next step. Several instructions are used here:
- grok allows specifying how each entry should be parsed. Many parsers are available by default and we specify here (with COMBINEDAPACHELOG) that each line should be parsed following an apache log format, this will allow automatic extraction of fields like creation time, request URL, source IP, return code, …
- mutate allows converting types of certain fields
- geoip allows obtaining geographical information from the source IP address
- date is used here to reformat the timestamp
output: specifies the destination for sending data once it has passed through the filter step
Launching the ELK stack
You can then launch the stack with the following command:
docker compose up -dOnce the images are pulled from Docker Hub, launching the application might take a few dozen seconds.
Then verify that all 3 services have been launched:
docker compose psThe Kibana web interface is then accessible on port 5601 of the host machine (we’ll come back to this later)
Using a test log file
We’ll first use a test log file and send its content to Logstash, which will be filtered and sent to Elasticsearch.
We use the mingrammer/flog image to generate log entries in Nginx format. The generated nginx.log file contains 1000 log entries.
docker run mingrammer/flog -f apache_combined > nginx.logThe following command sends each line to Logstash:
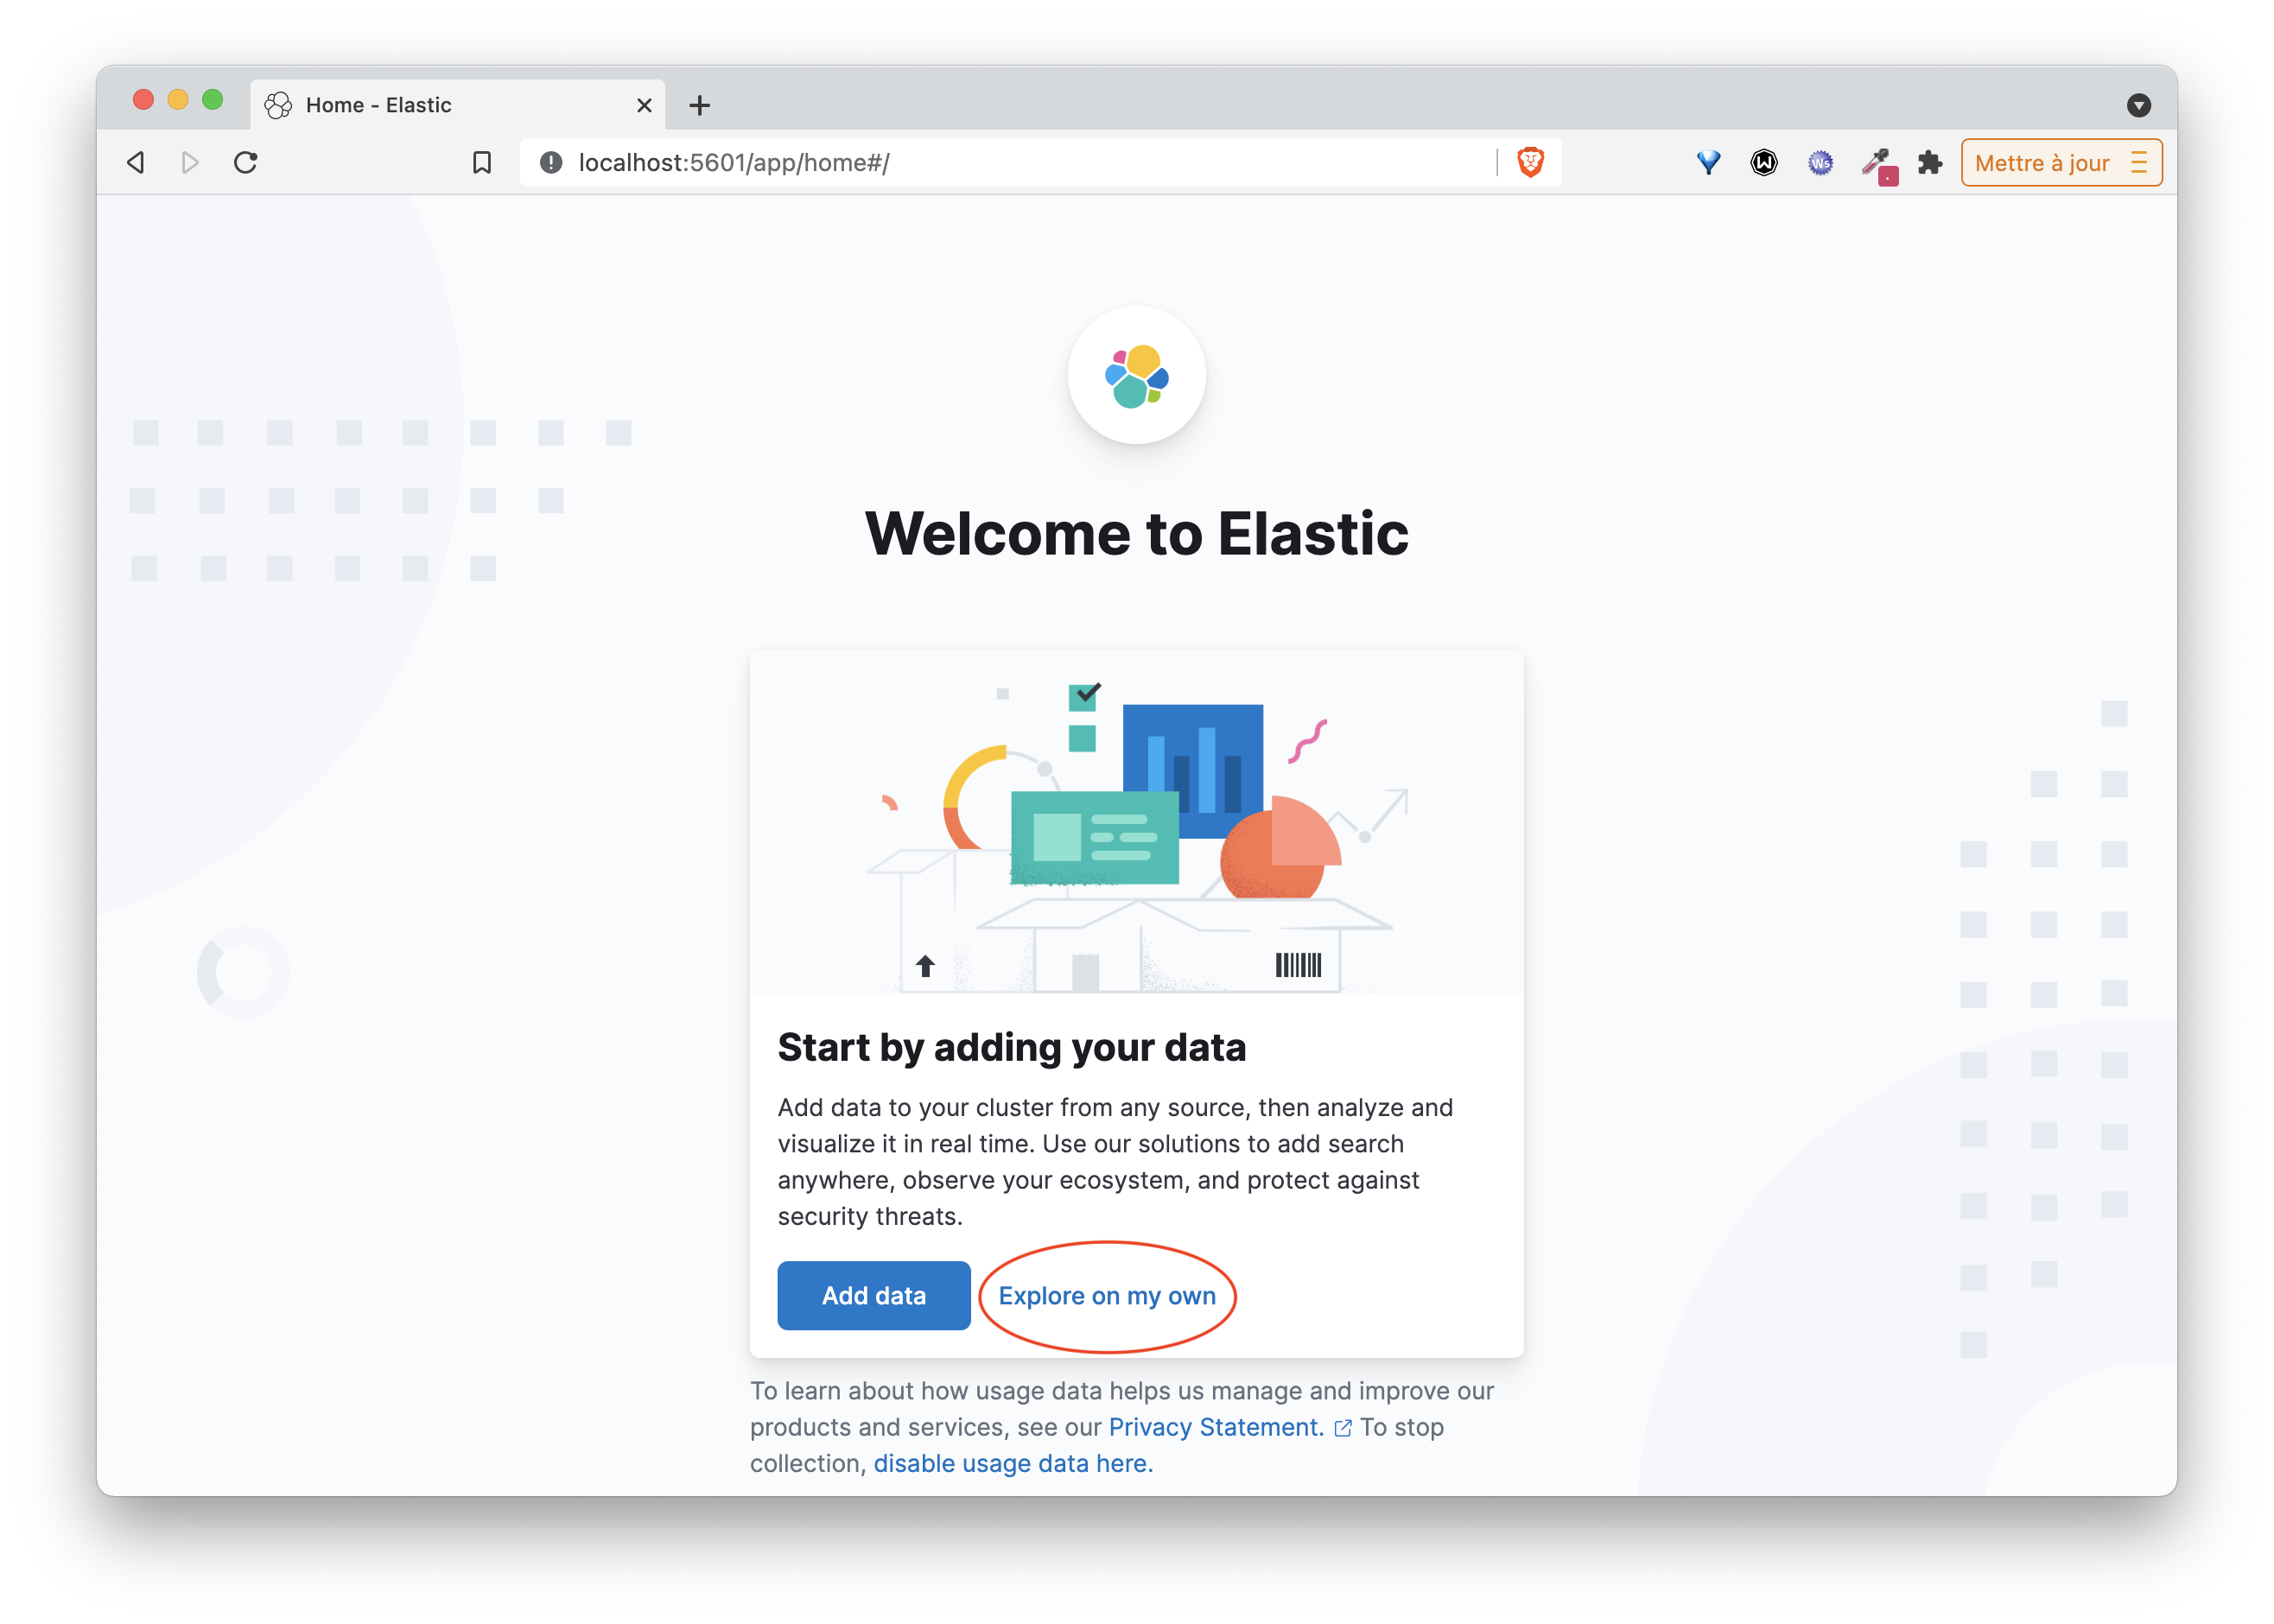
while read -r line; do curl -s -XPUT -d "$line" http://HOST:8080; done < ./nginx.logOnce the script is finished, open a tab to the Kibana interface http://HOST_IP:5601 (replacing HOST_IP with the IP address of the machine where the Elastic stack was launched)
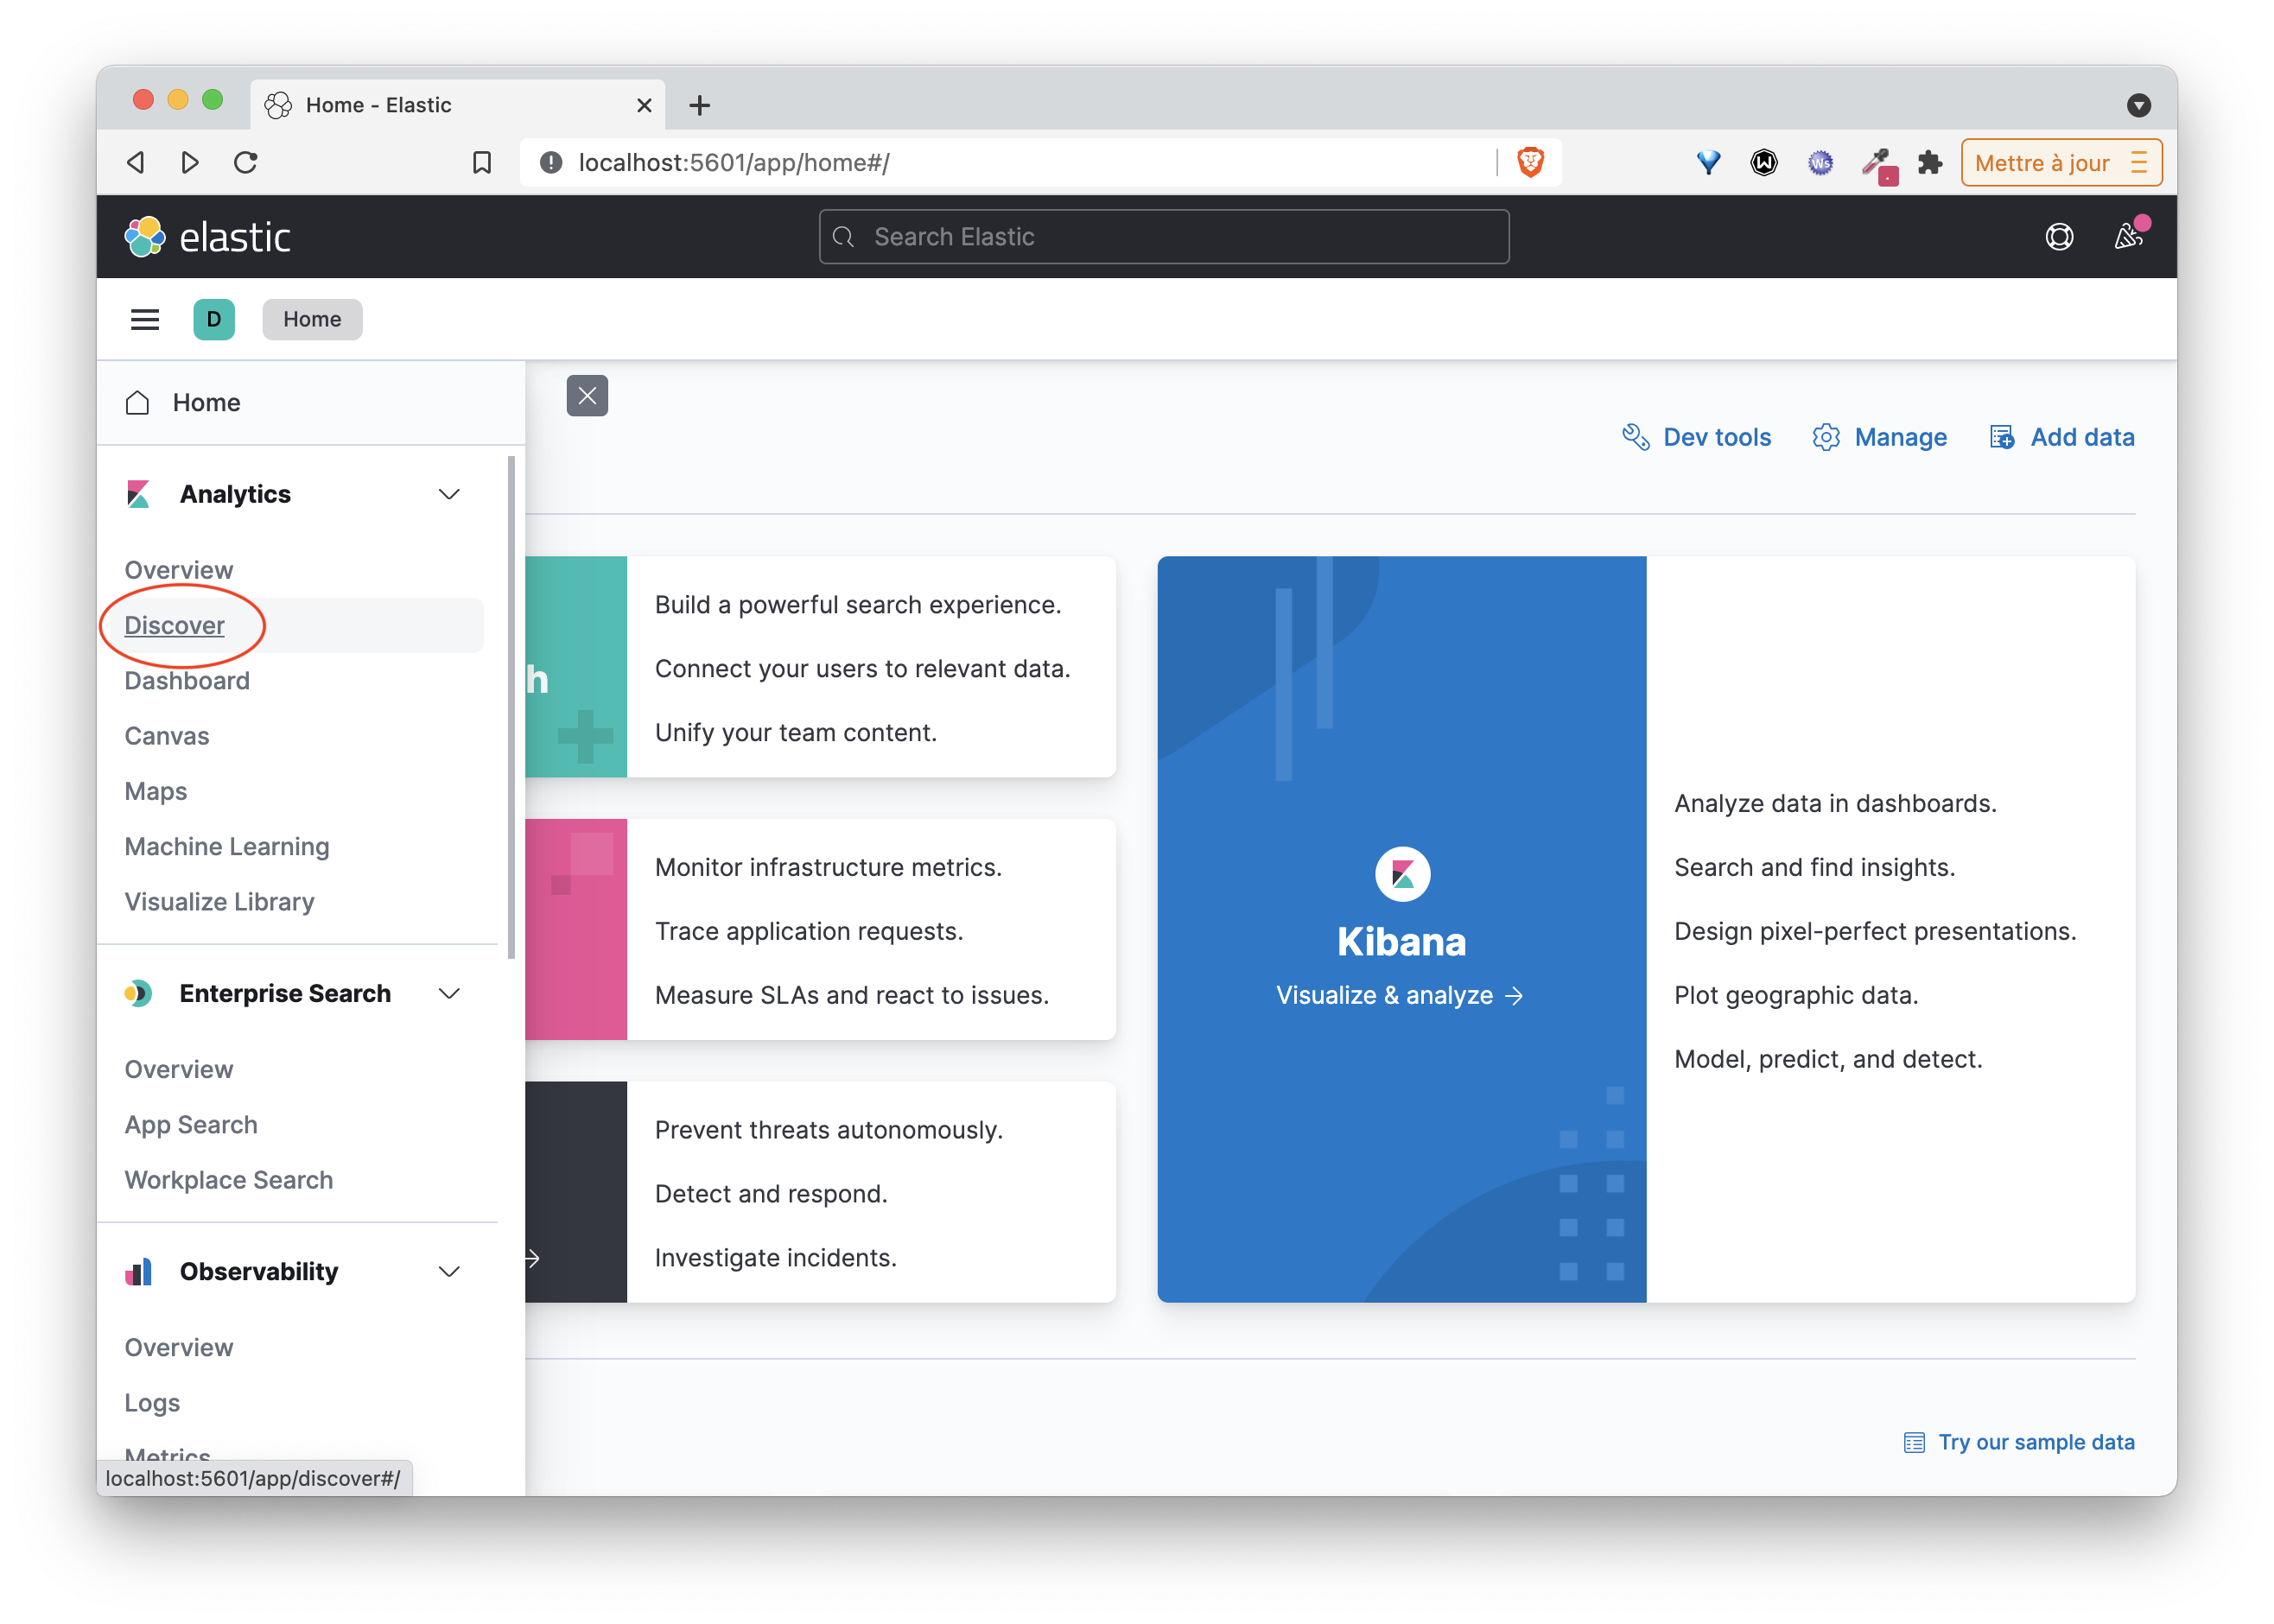
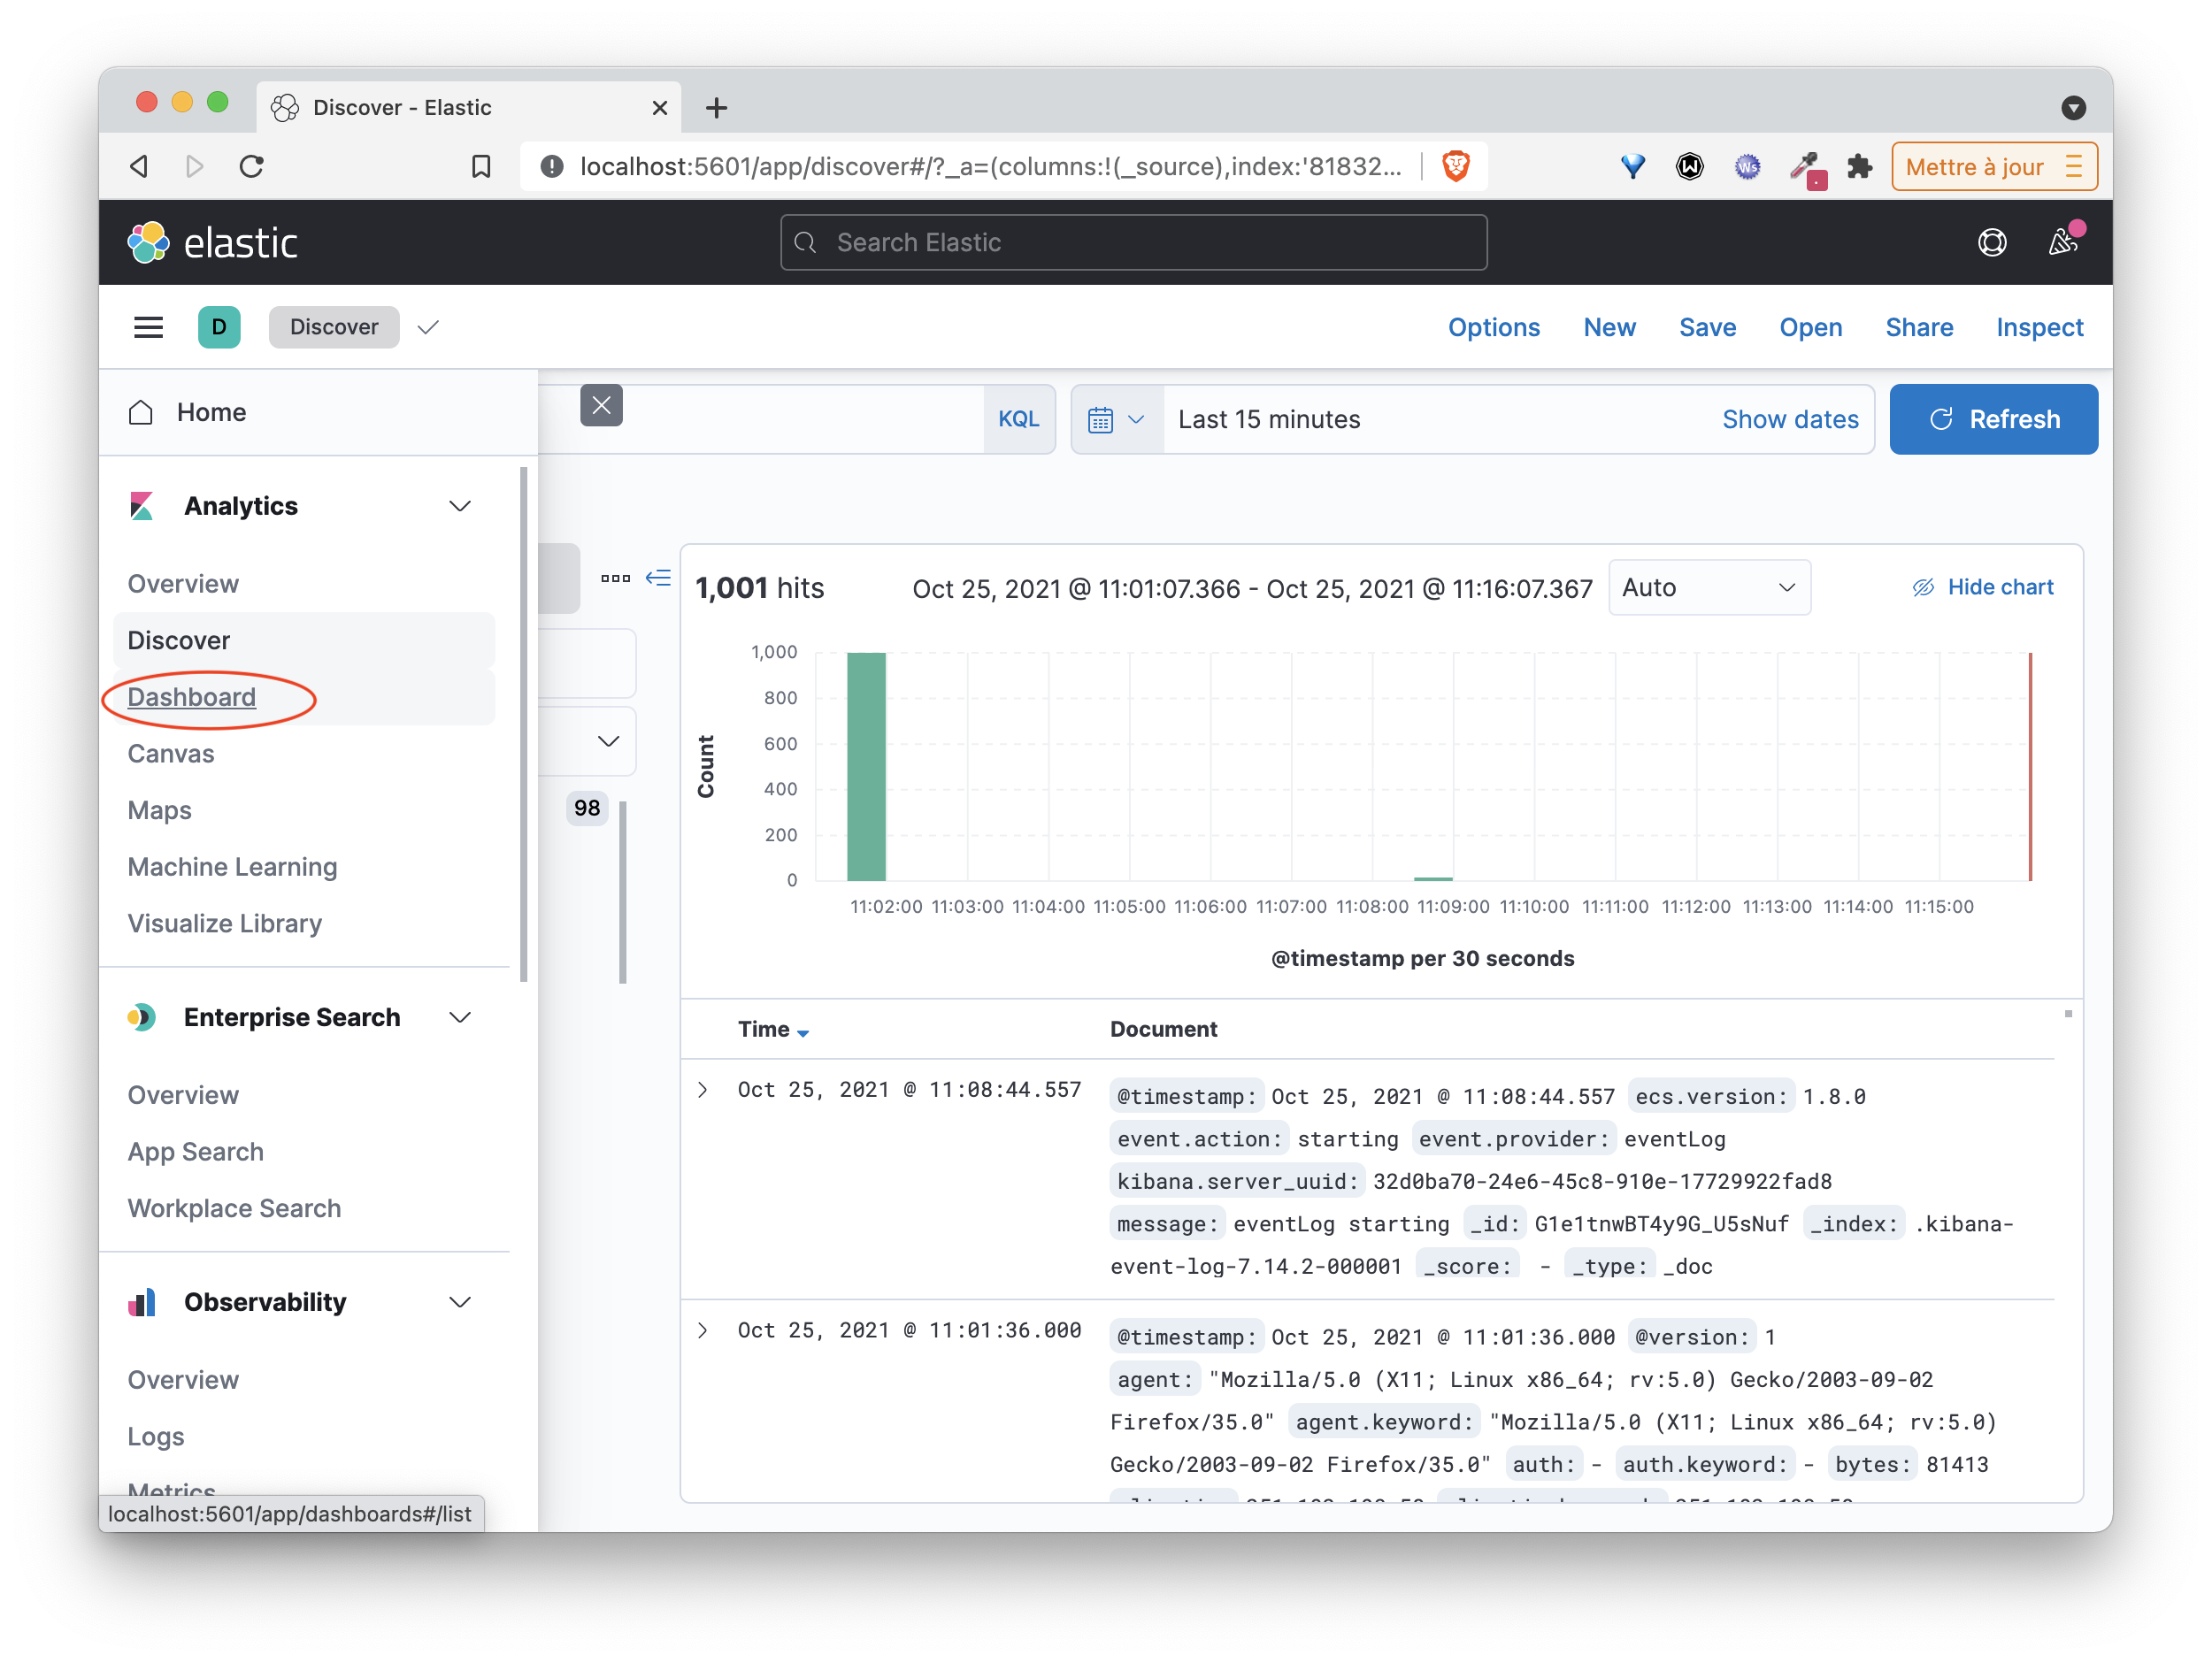
Click on the Explore on my own link then on Discover in the Analytics category of the left menu
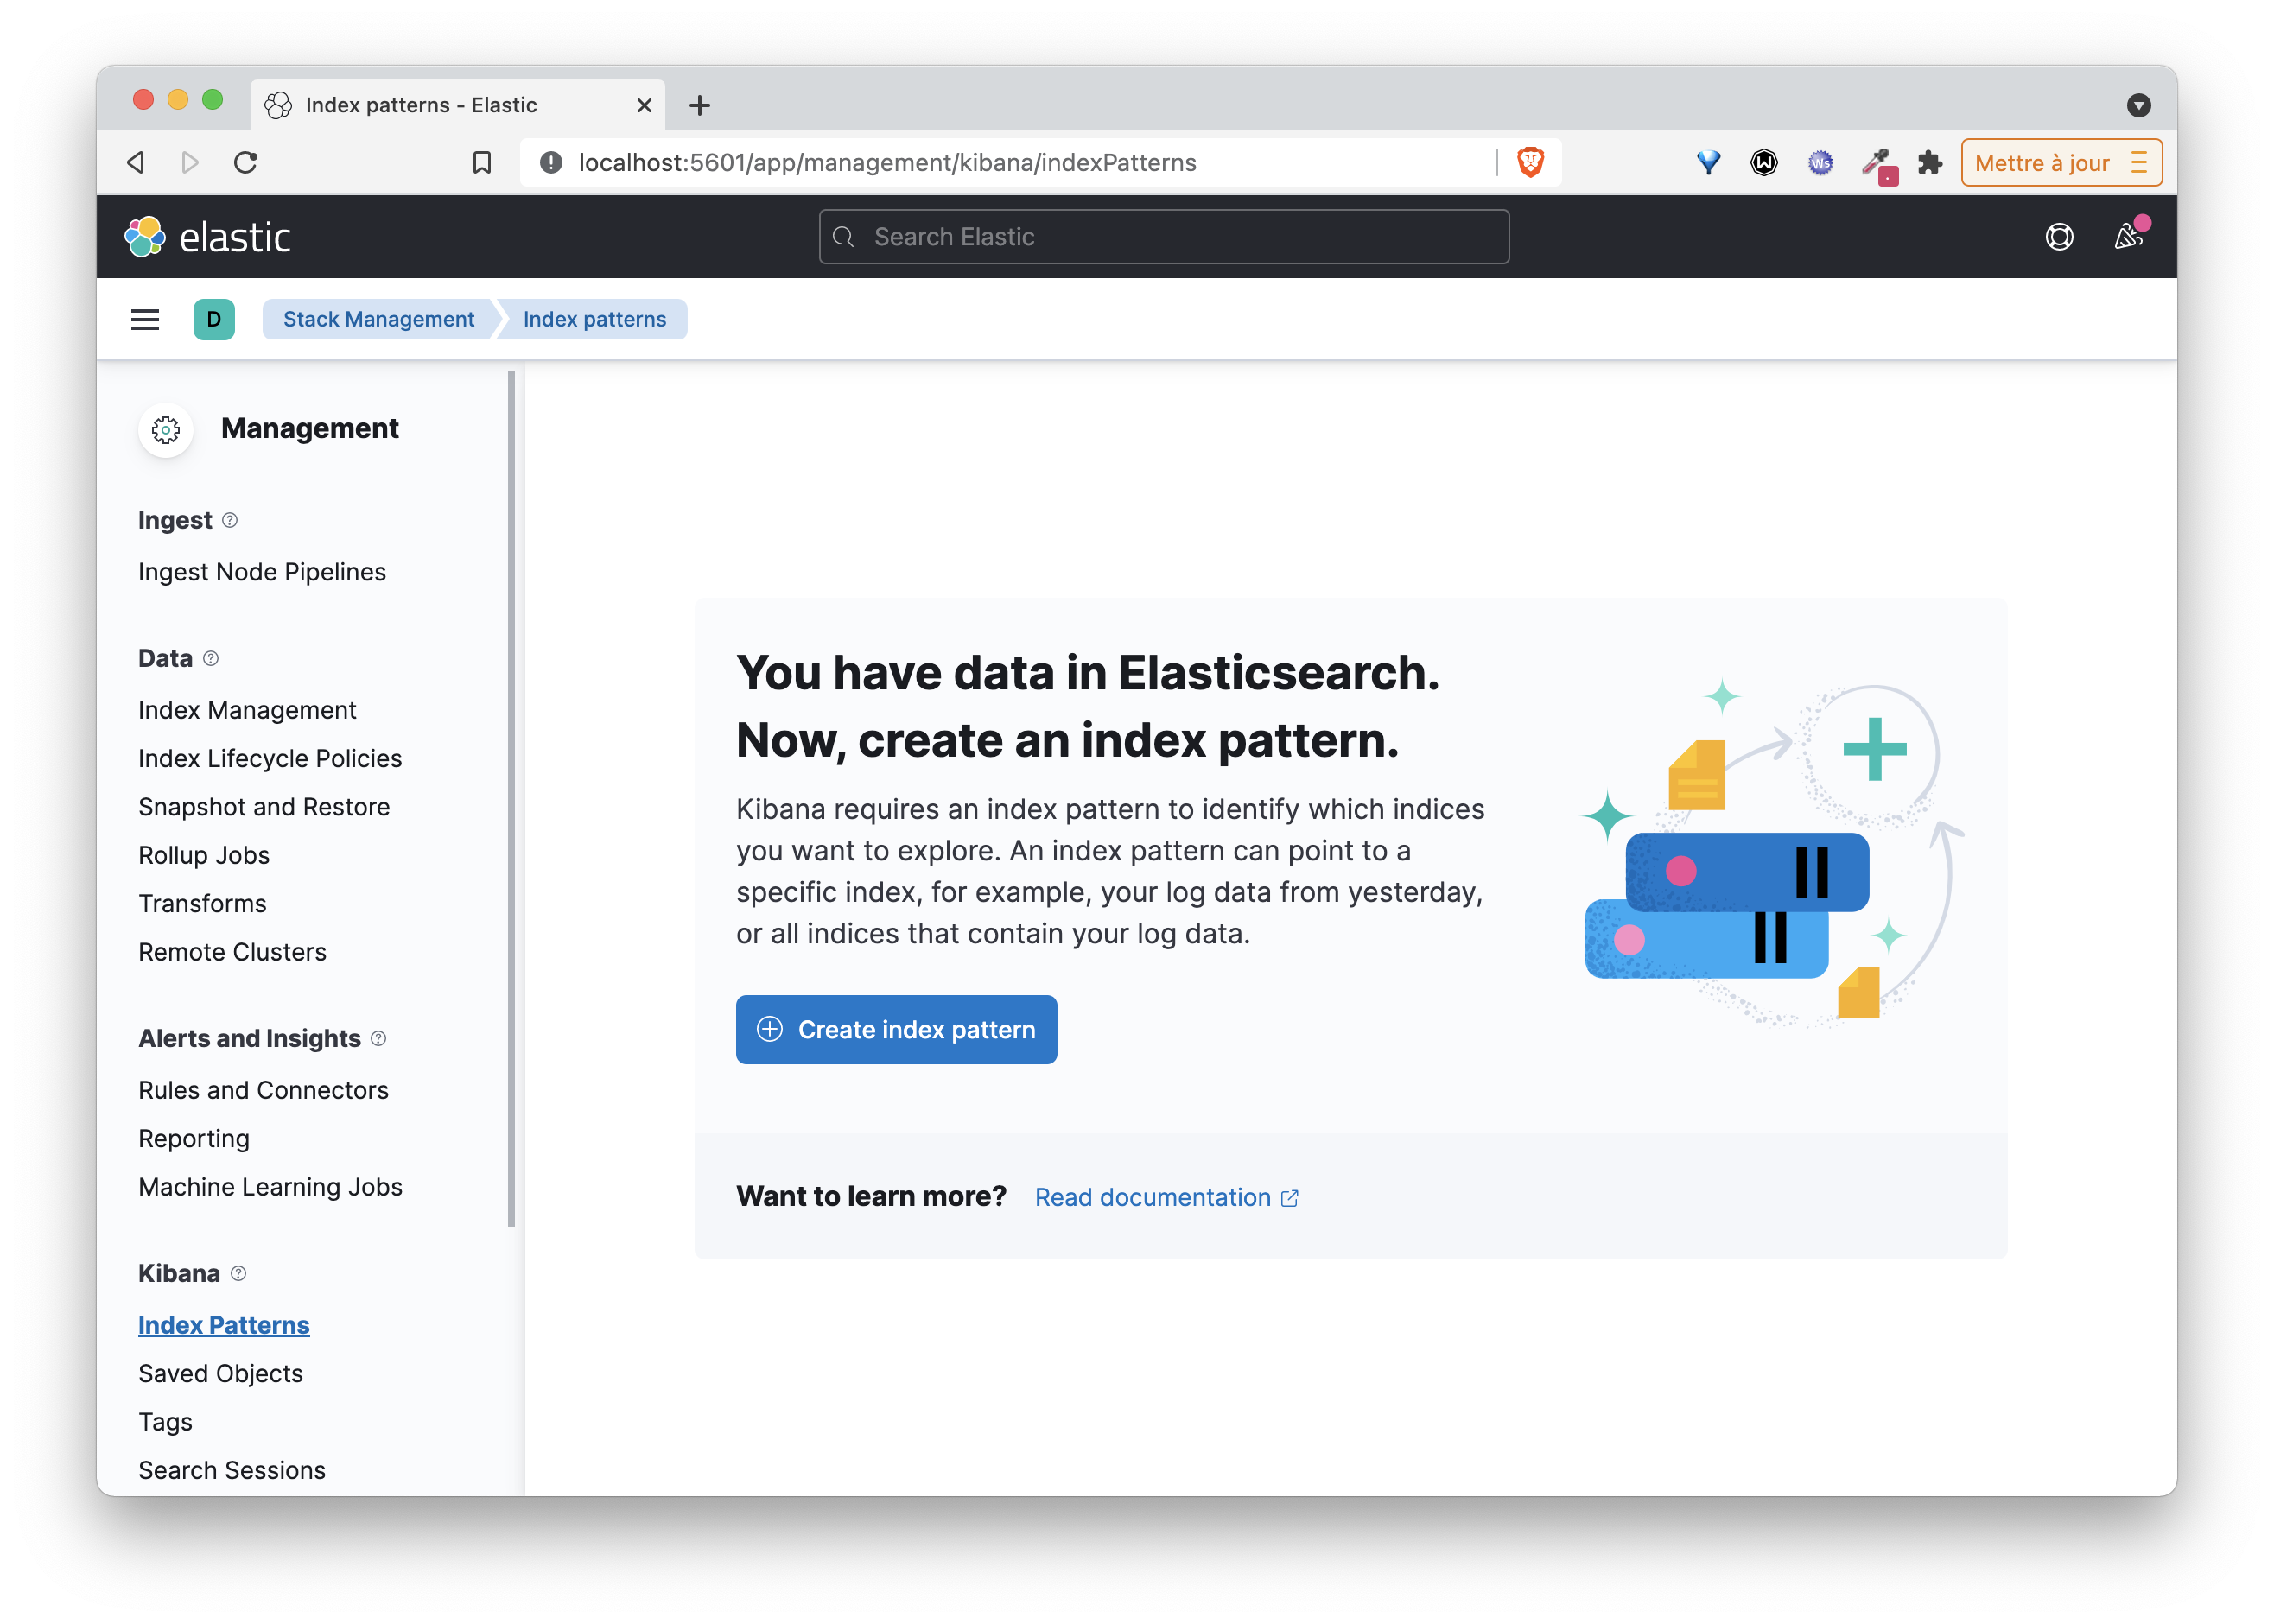
Then follow the instructions to create an Index Pattern that will allow indexing the logs you’ll send later.
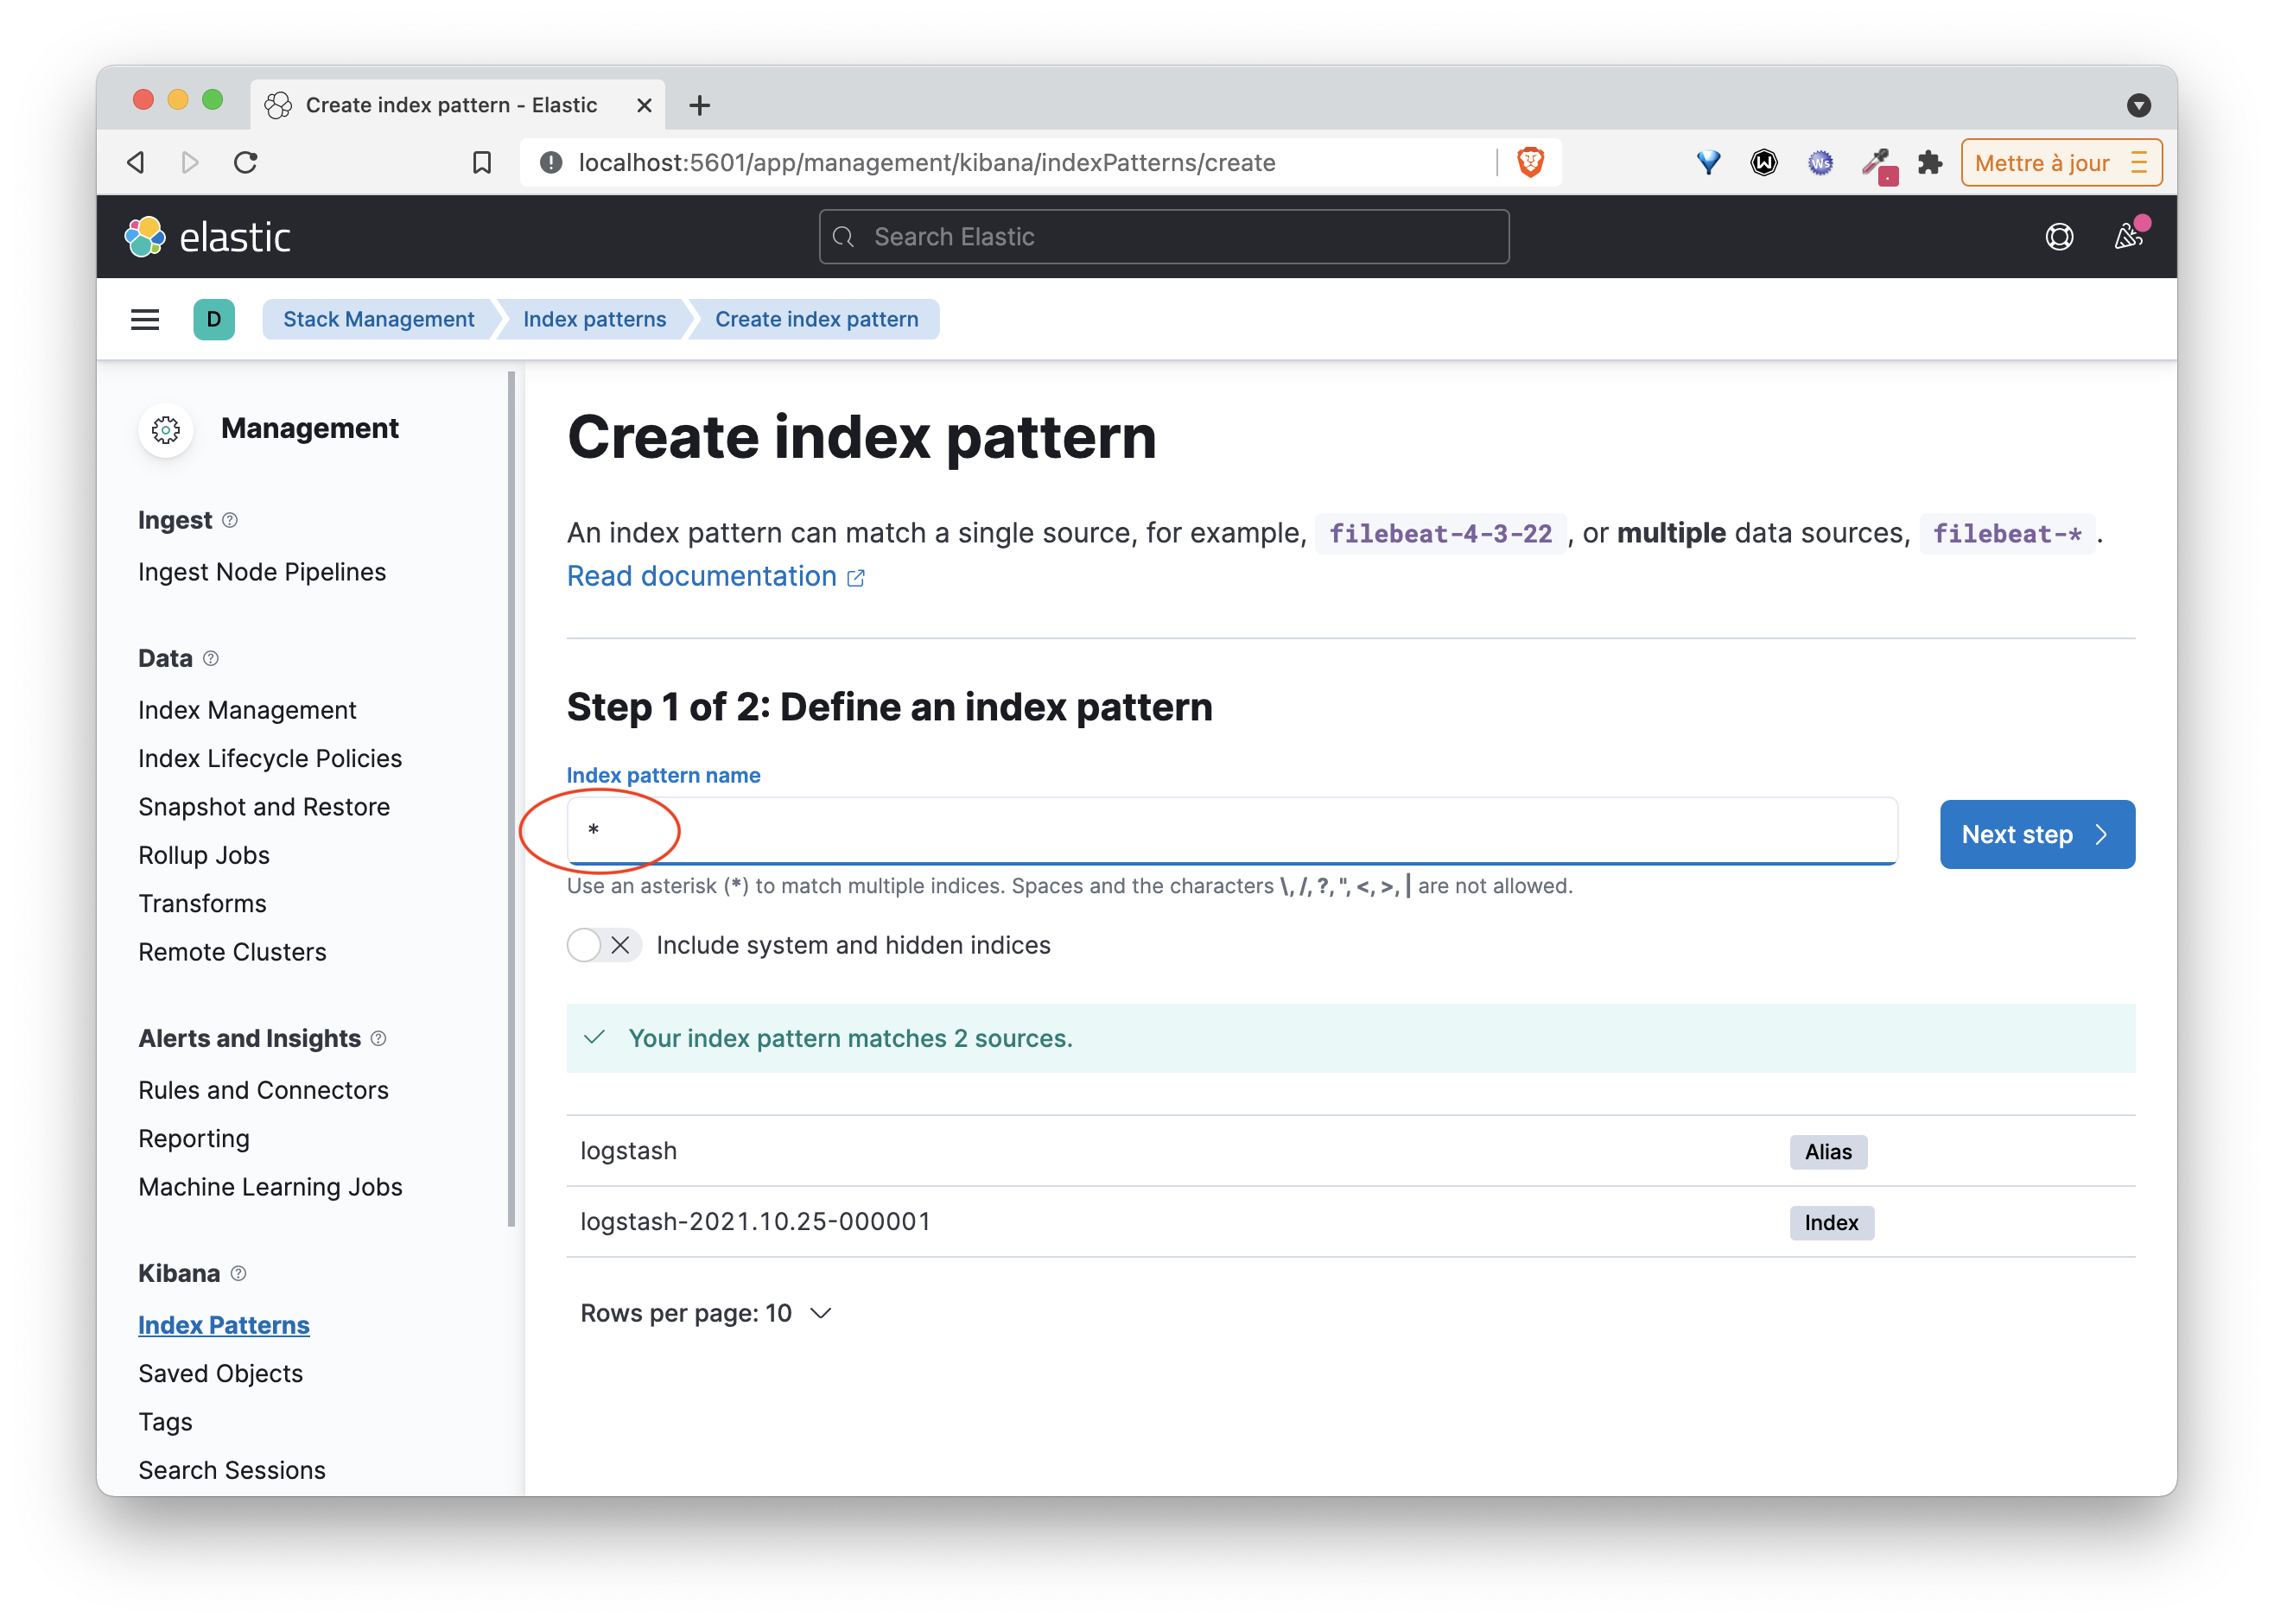
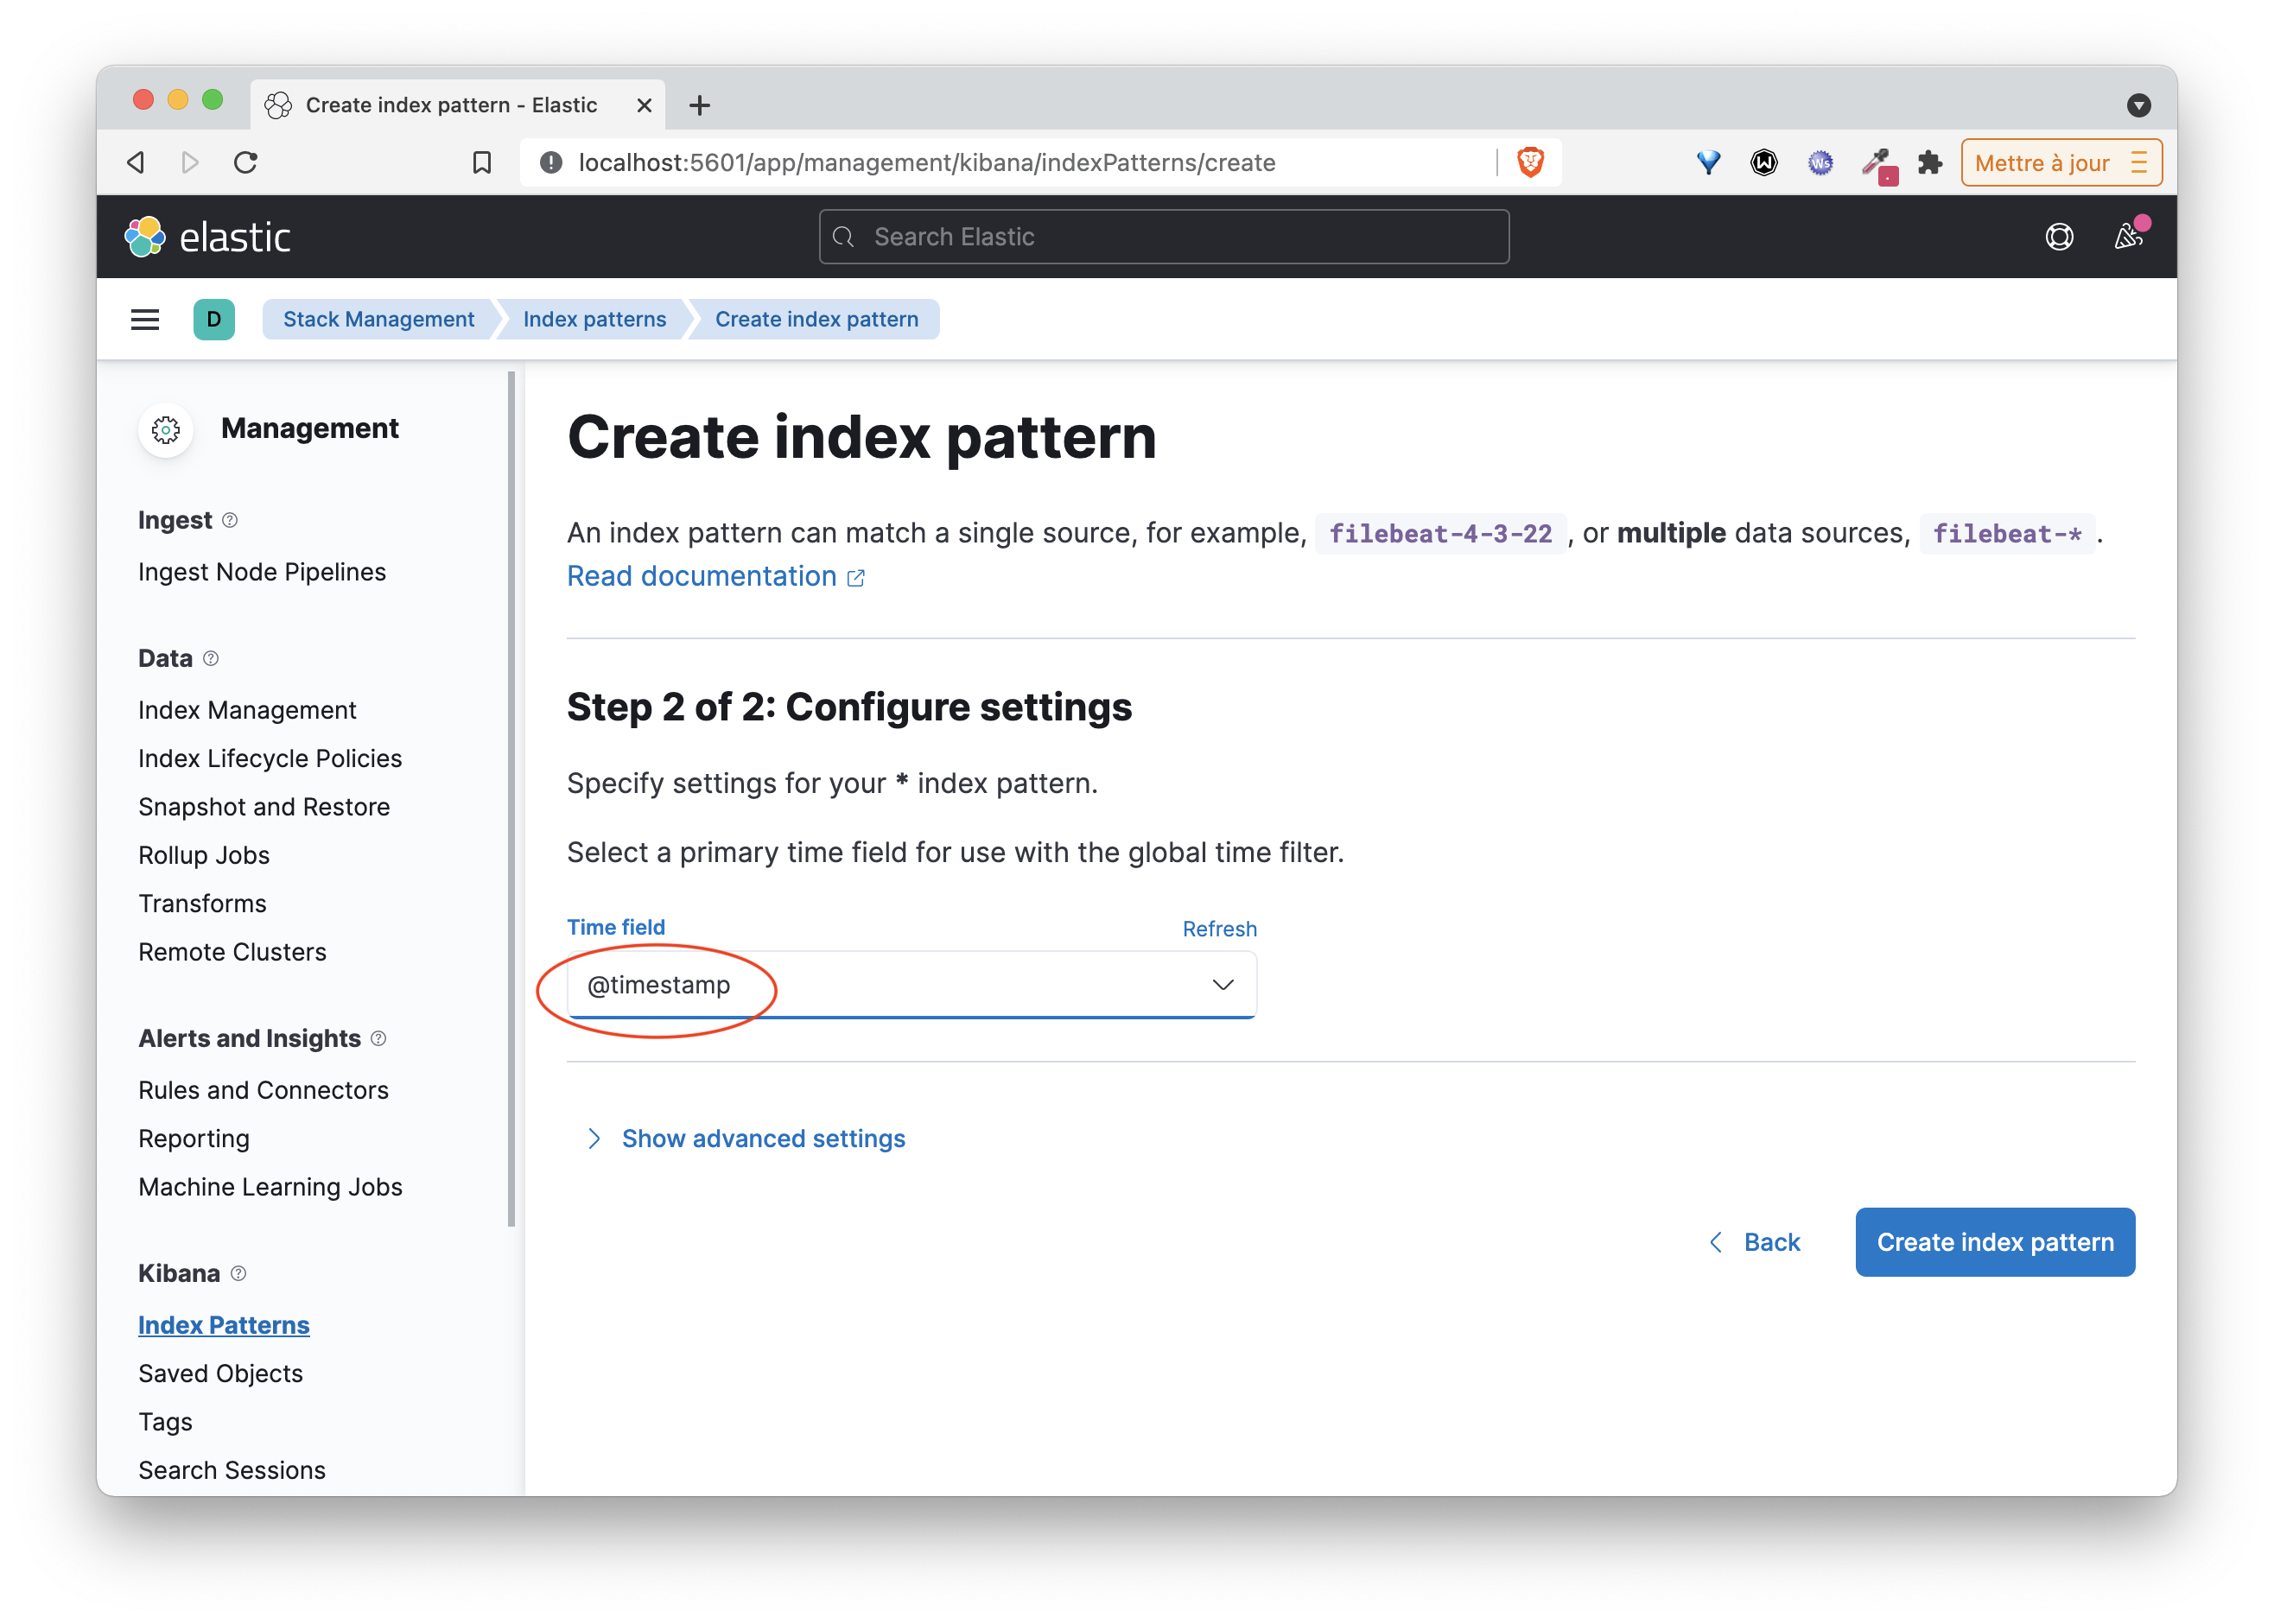
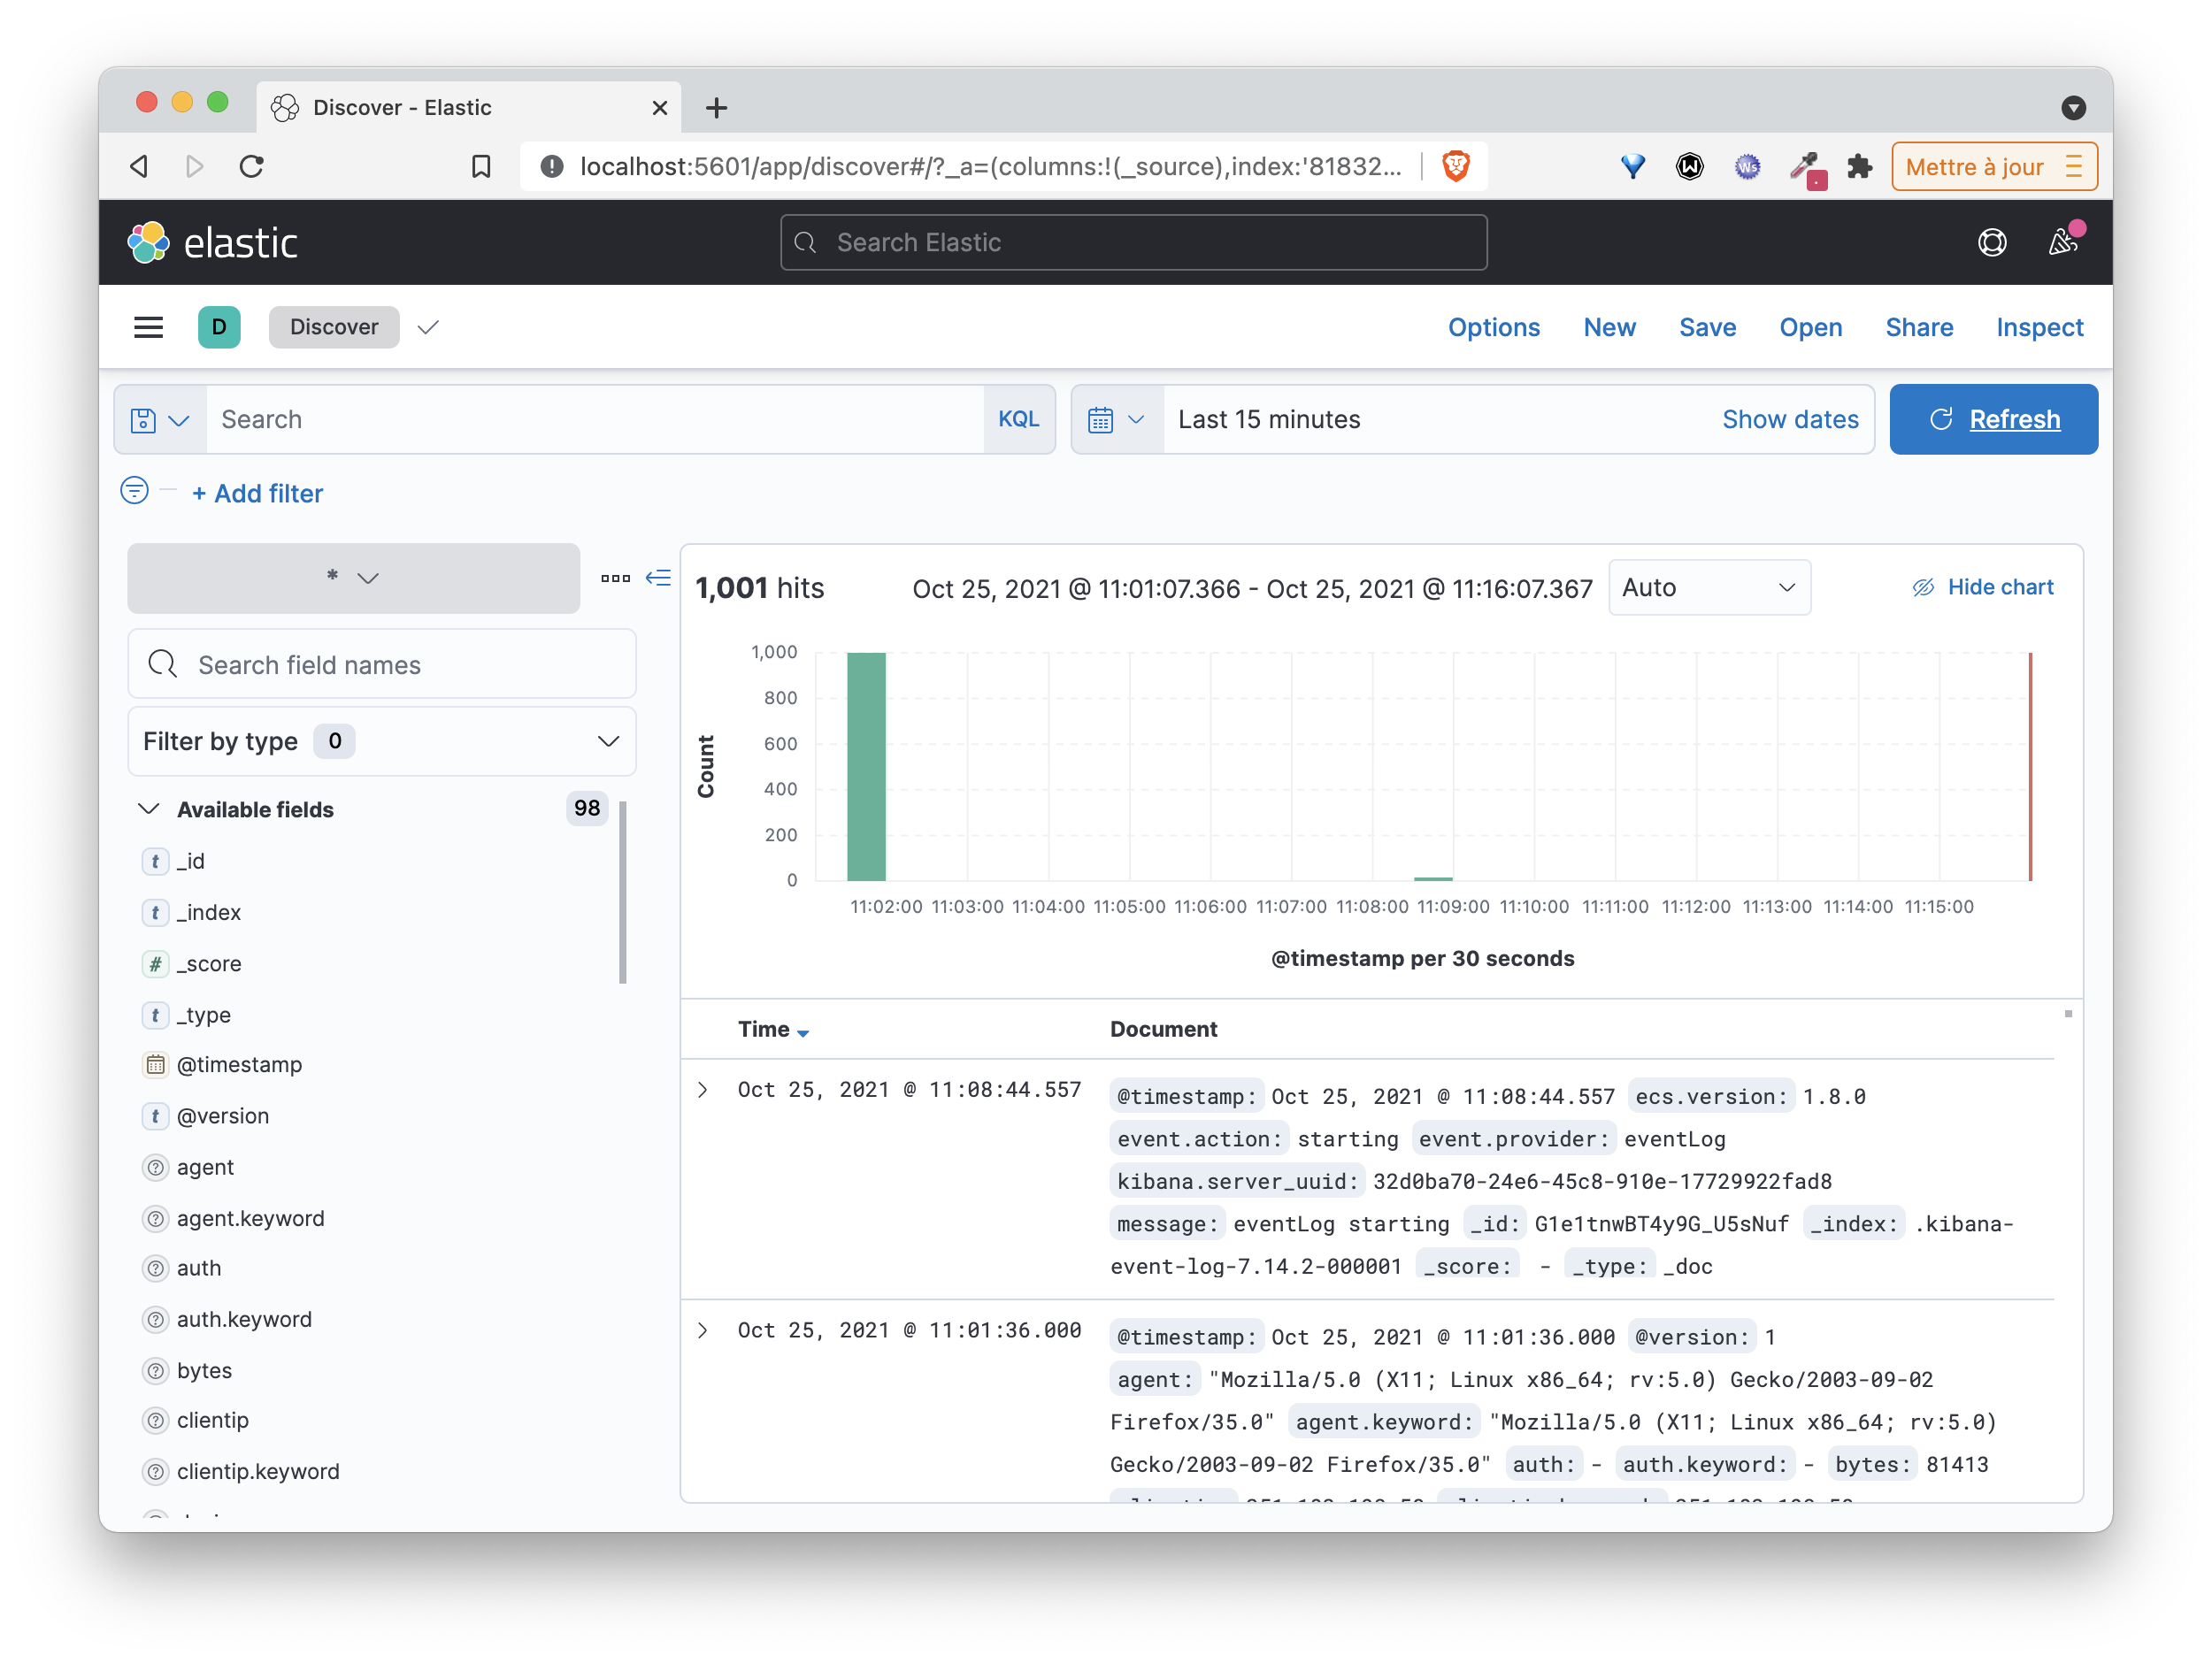
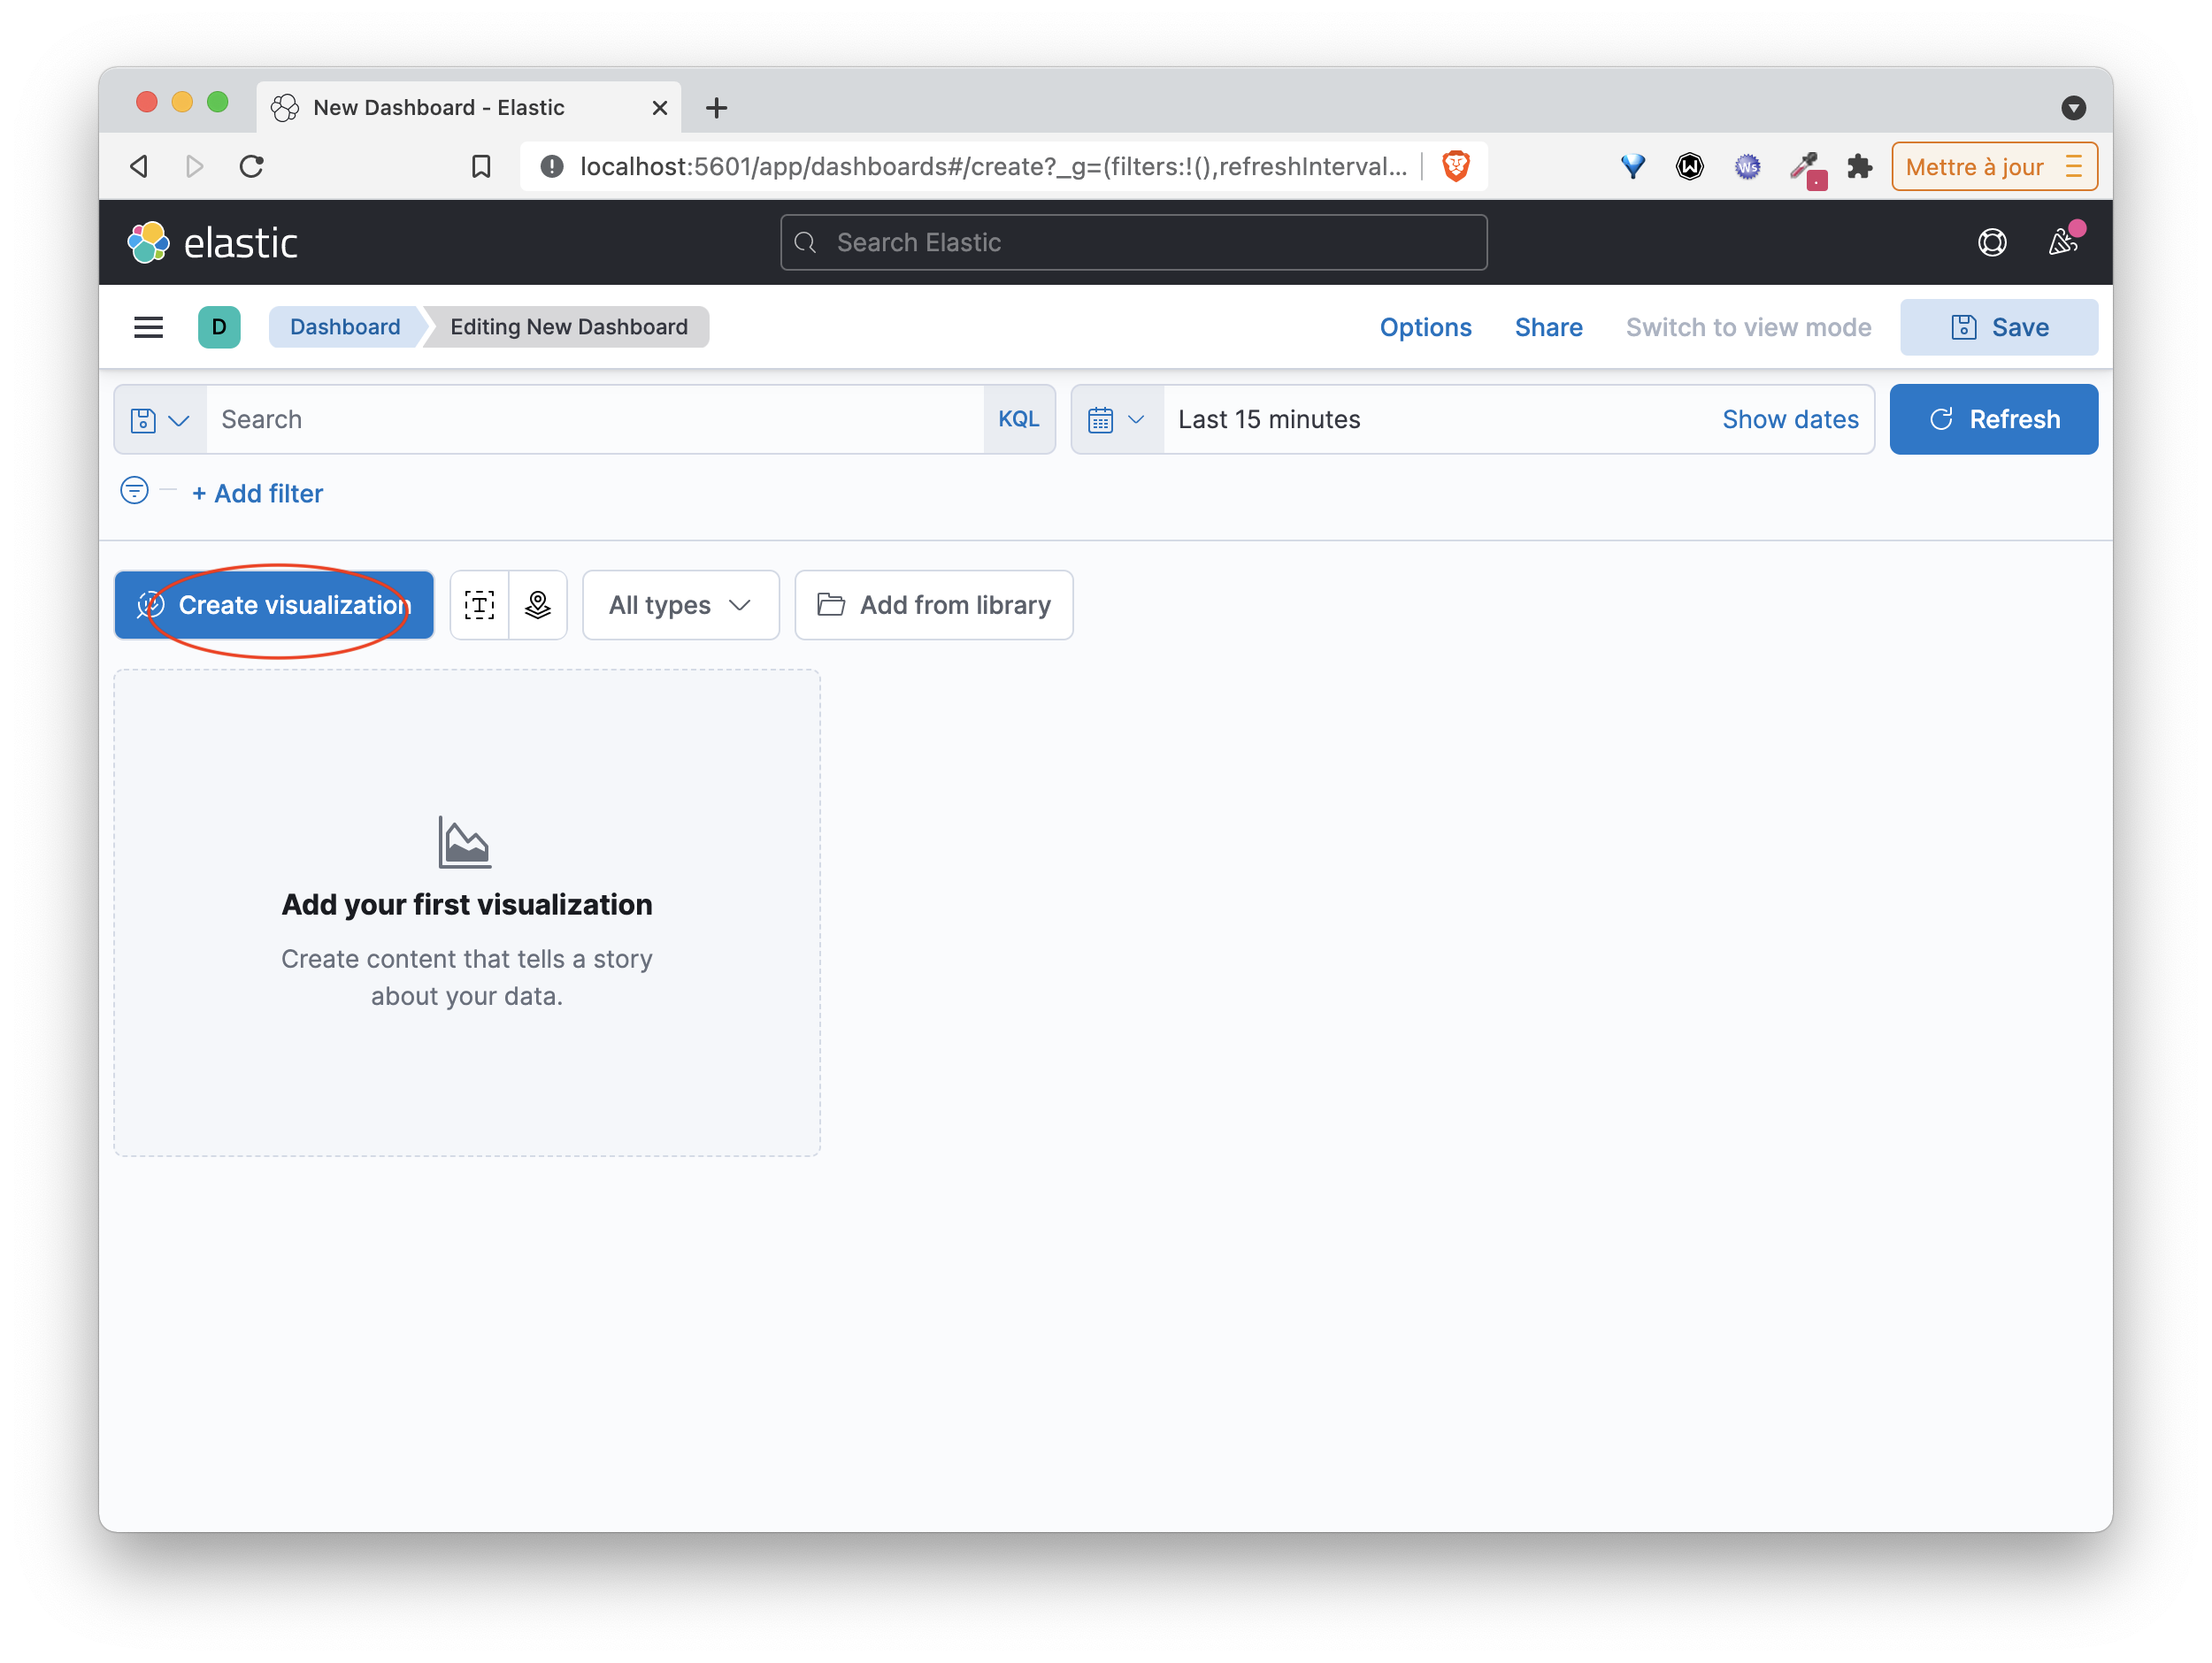
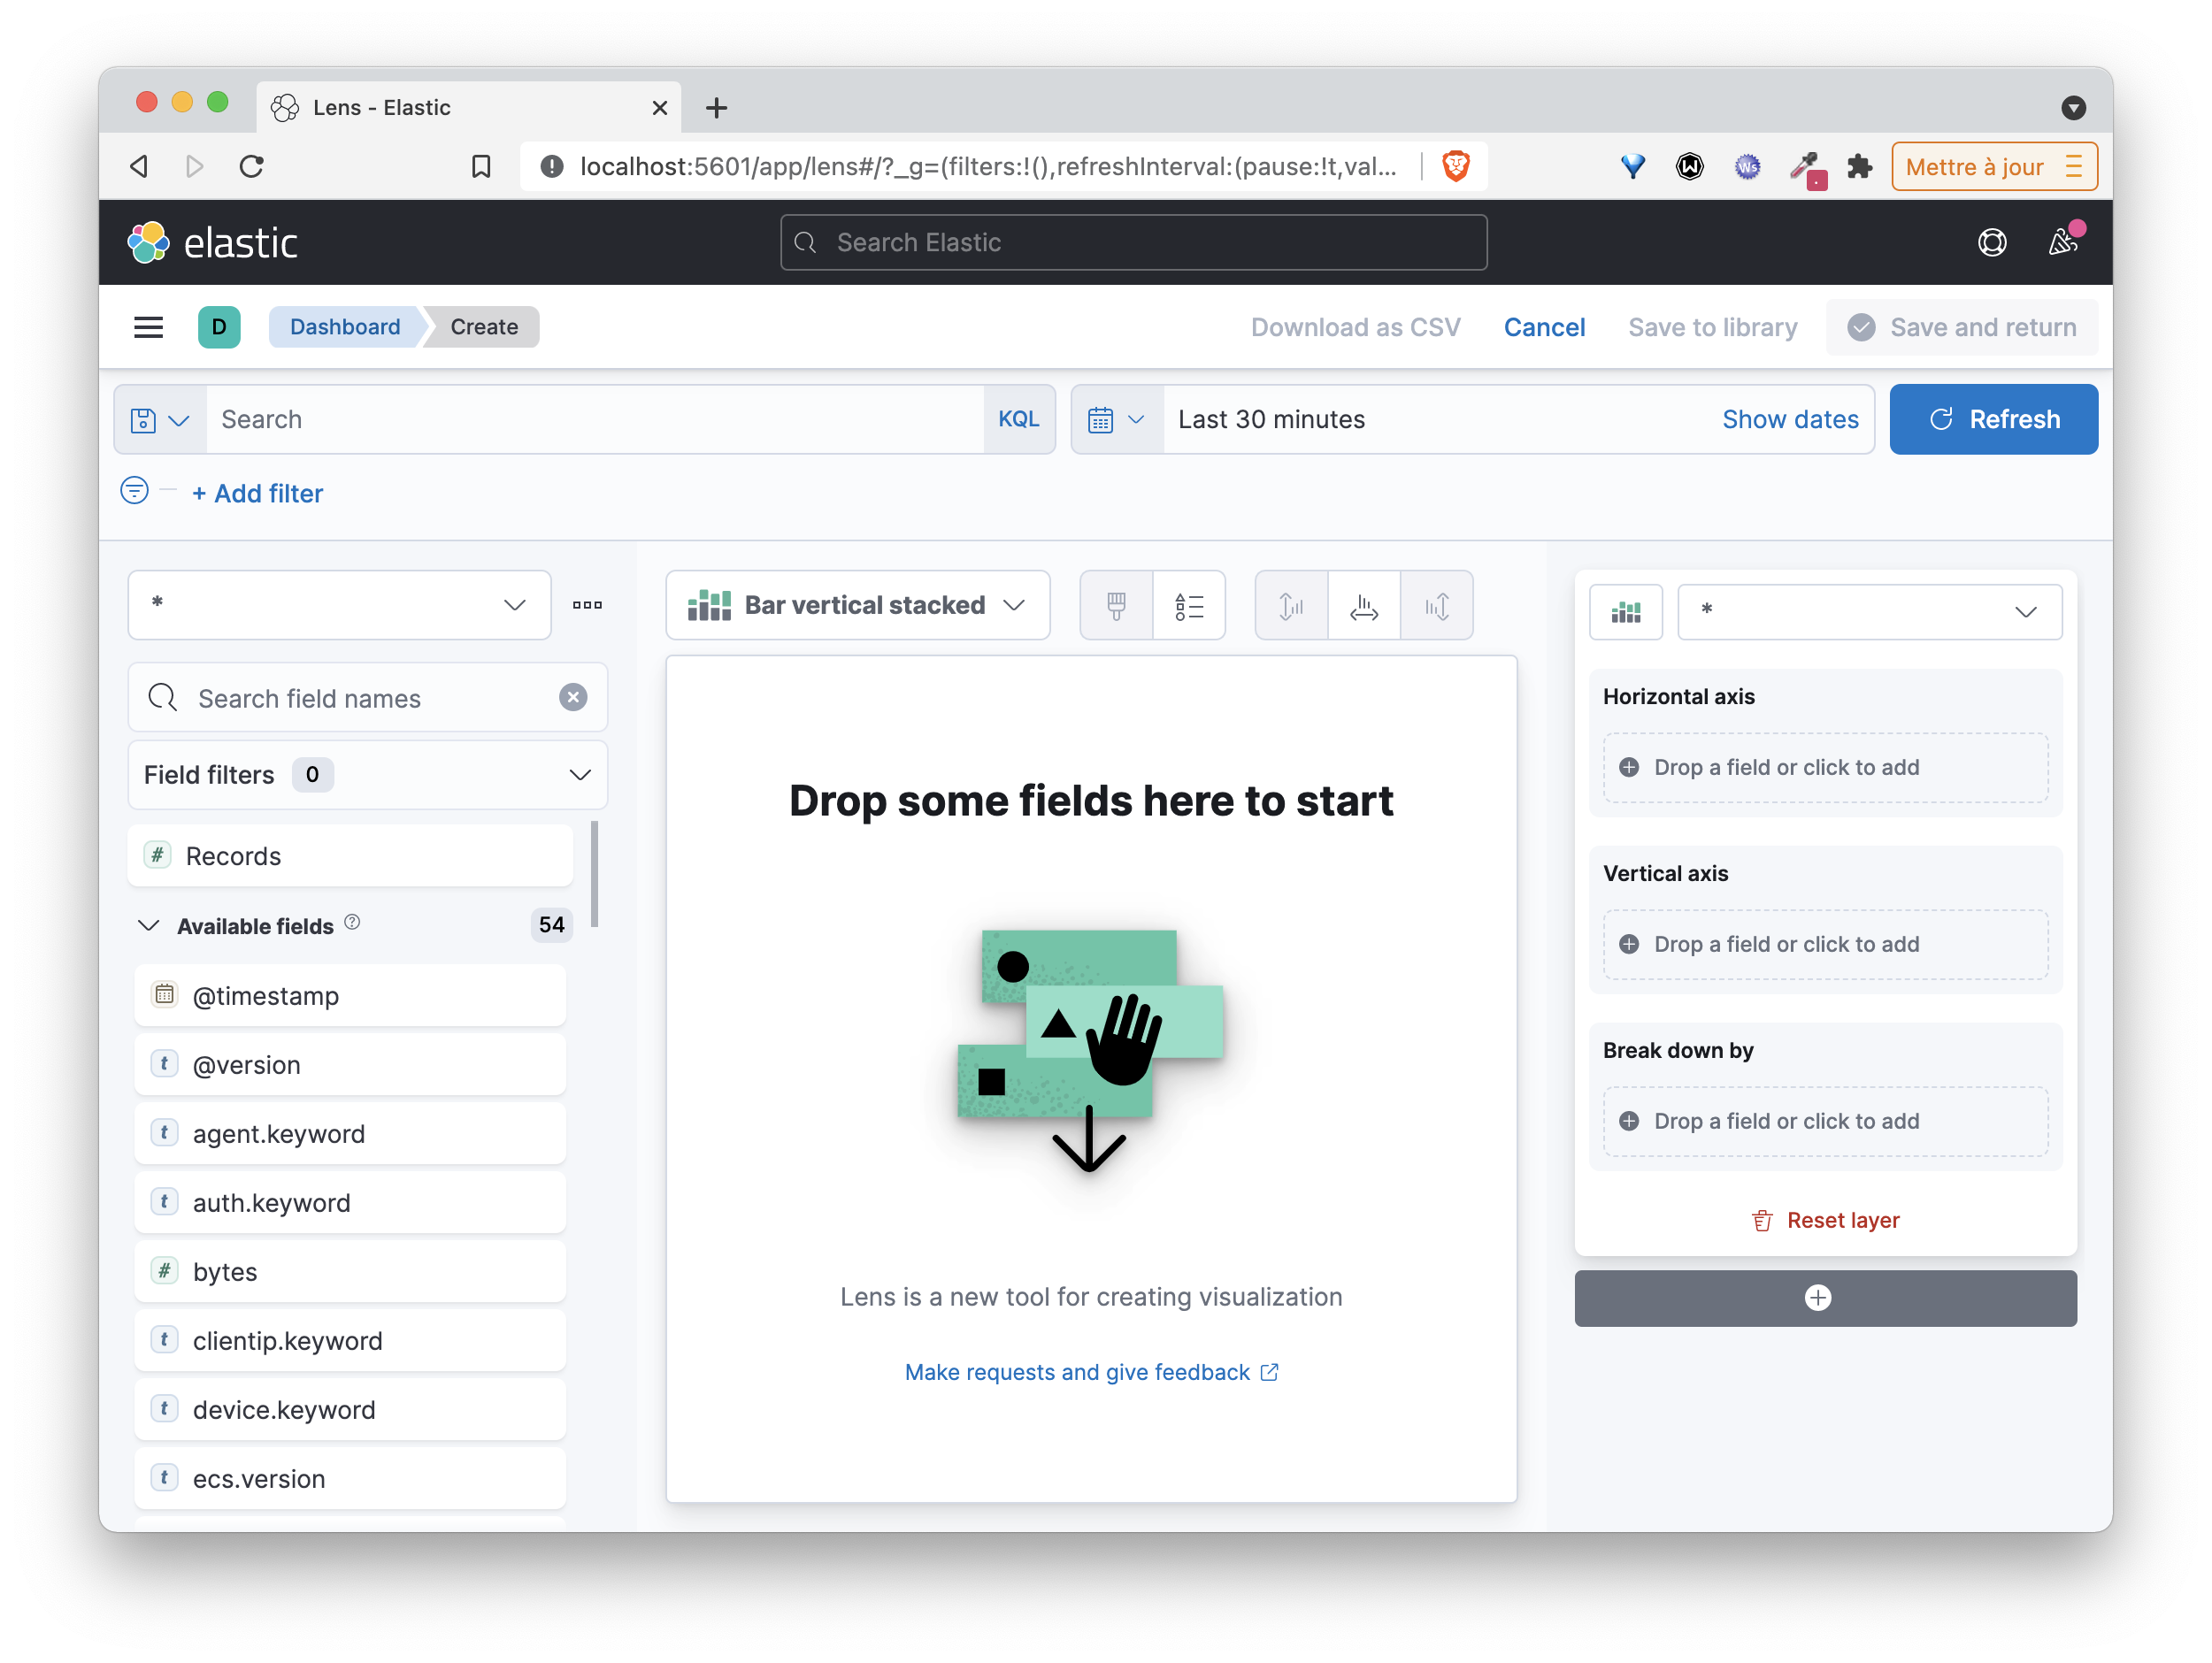
Kibana allows creating visualization dashboards and thus exploiting the information contained in the logs. The following screenshots detail the steps for creating a first visualization.
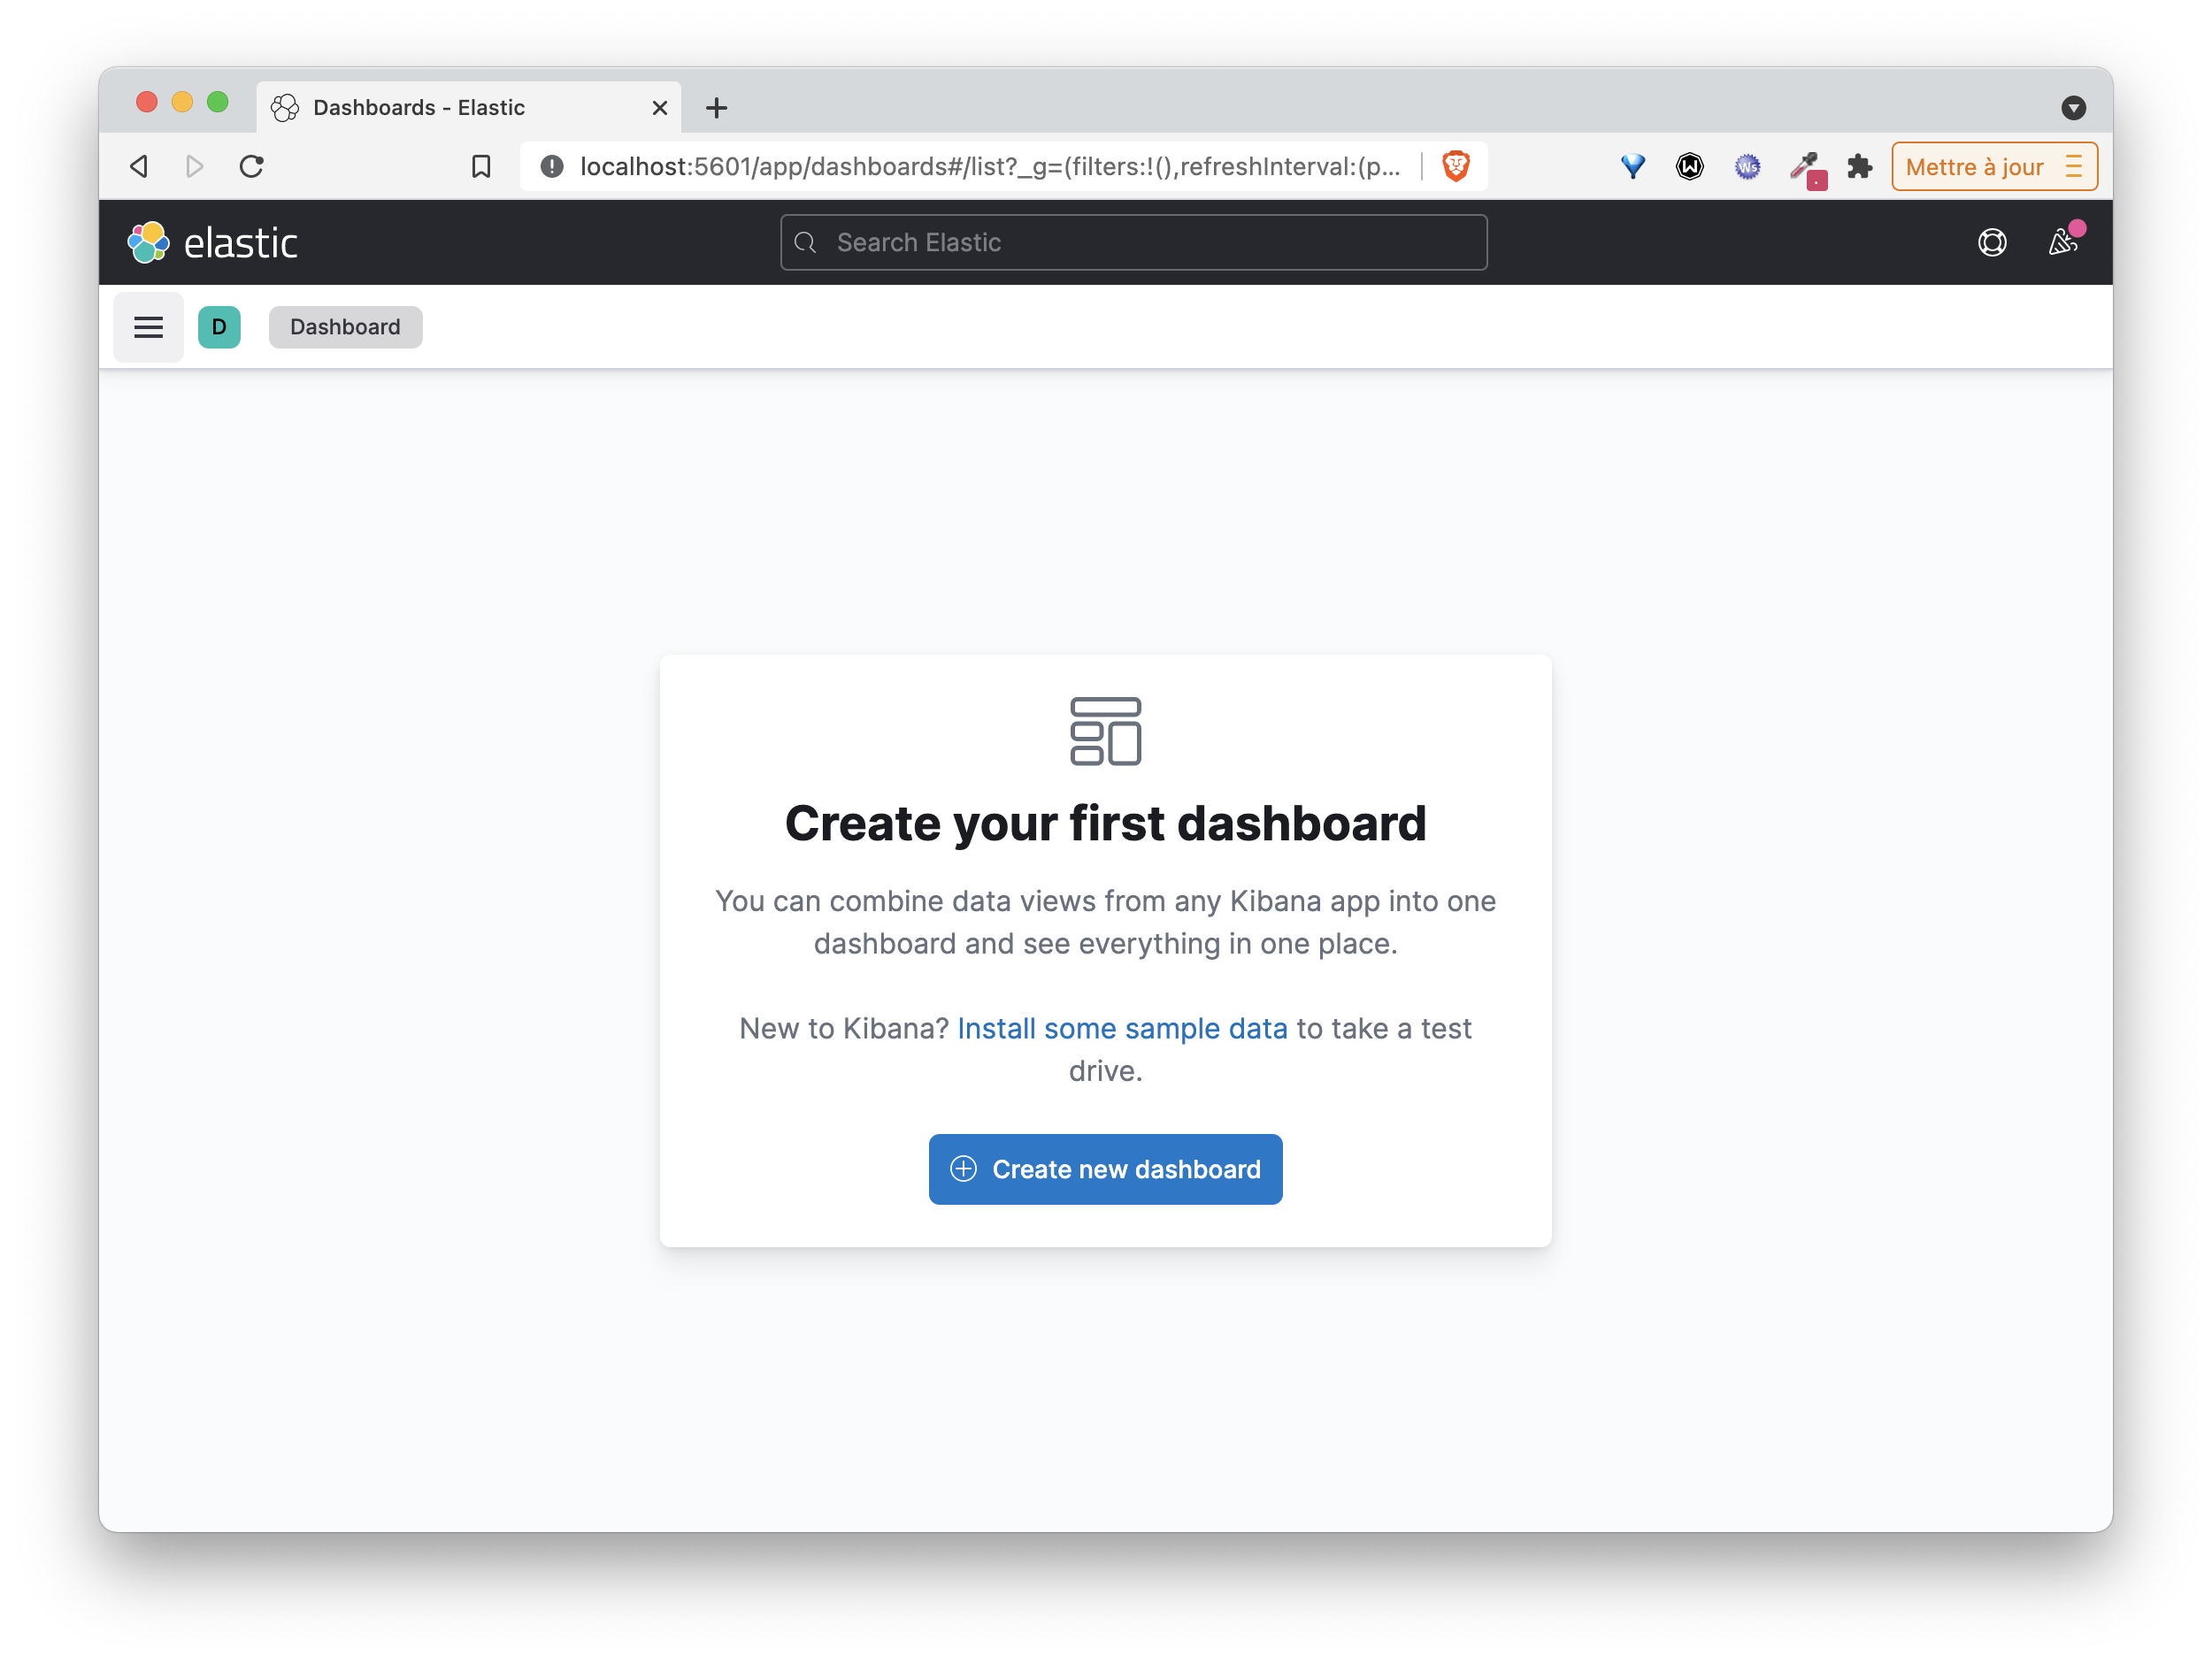
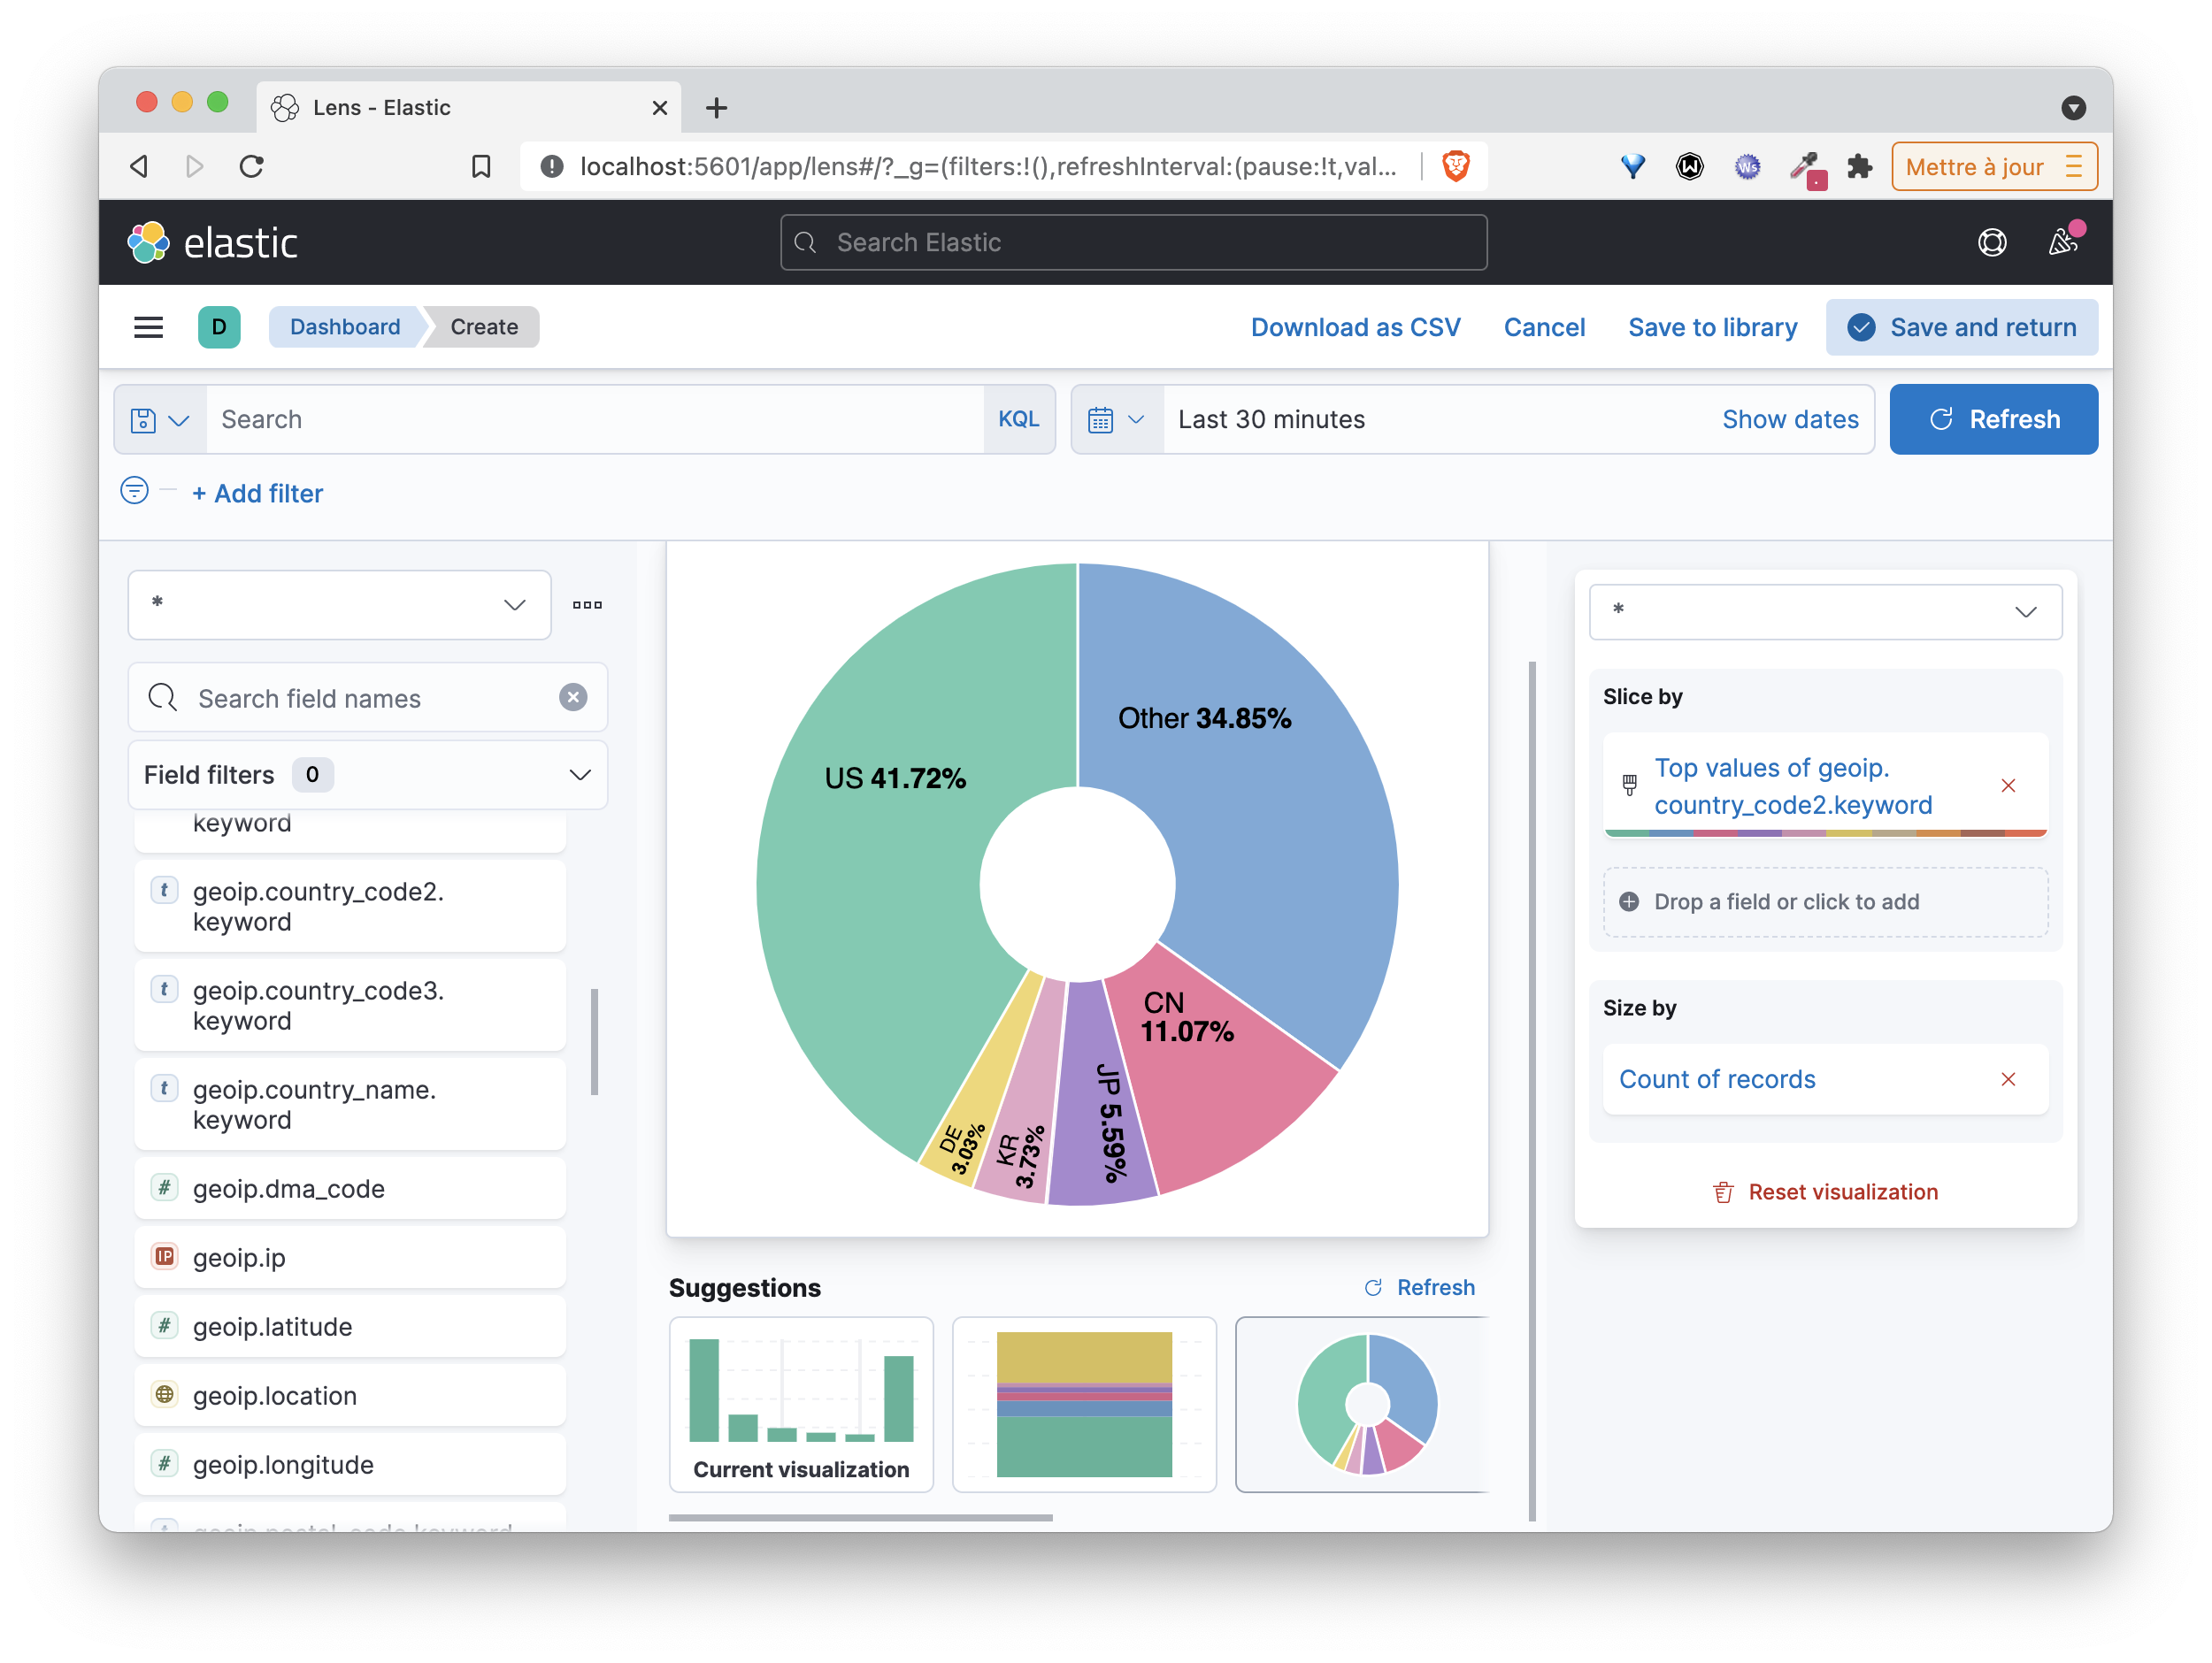
Then manipulate the interface to create your own visualizations and a dashboard to group them.
Cleanup
You can then remove this stack using the following command:
docker compose down -v